Team:Aix-Marseille/Experiments
Materials and methods
Why M. smegmatis ?
M. smegmatis is commonly used in Mycobacteria research because of its important growth rate. The time and heavy infrastructure needed to work with pathogenic species have prompted researchers to use M. smegmatis as a model for mycobacterial species. They share more than 2 000 homologous genes with M. tuberculosis and share the same wall structure cell. These many properties in common have pushed us to carry out our work on M. smegmatis. Once we master the PSR, we'll run the tests on M. tuberculosis cultures provided by Dr. CANAAN for safety.
Primers design
The PSR primers were designed based on the alignment of four published sequences of the rpoB gene of M. tuberculosis (Genbank access numbers: MG995113.1, MG995115.1, MG99511.1 and MG99511.1) and the identification of two regions with high degree homology framing the region where the mutation responsible for acquiring resistance to Rifampicin is. It's done using Clustalo mutiple alignment tool. The alignment file included various rpoB DNA sequences of various Mycobacteria species to select the most specific region for M. tuberculosis.
Afterwards, an oligonucleotide sequence of exogenous origin, described by Liu and al, has been incorporated within the 5’ of each primer. We extracted the N and Nr sequences of a botanical gene to avoid a non-specific reaction with the target gene. The physicochemical characteristics of the different primers were established using the Primer3Plus software. While the specificity of the different primer sets has been evaluated in silico using the Primer3Plus software against the nr/nt database. The primers designed for M. smegmatis were developed using the same procedure.
Alternatively, we used a primer set specific to M. tuberculosis suitable for M. smegmatis: Ft (5'-GTGCCCGCAAAGTGTGGCTAACTTGCGCGATGGCGAACTCA-3') and Bt (5' GTGCCCGCAAAGTGTGGCTAACTTAGTTTGGTCATCAGCCGTTC-3') described by Liuyu Huang et al. These primers served as positive control. The primers designed for amy1 were designed with the exception of their specificity and their sensitivity because firstly they serve as the amplification positive control. The gene codes for the amylase protein. It's abundantly present in the sputum sample.
DNA extraction
DNA was extracted from a 1 mL M. smegmatis culture. The measured DNA concentration by NanoDrop was 104 ng/µL. The M. tuberculosis DNA was provided by Dr. CANAAN. The DNA extraction was carried out using a 1 mL pellet using the kit. The measured DNA concentration by NanoDrop was 81 ng/µL. amy1 DNA was extracted from a 1 mL sputum sample. All DNA extractions were done using the NucleoSpin® Microbial DNA kit.
Amplification
PSR assay was carried out at a temperature of 62°C and a time span of 60 minutes. The reaction mix consisted of 1 uL forward and reverse PSR primers, 1.4 mM dNTPS (from Sigma-Aldrich), 0.6 M of Betaine, 4 mM MgSO4, 12 U of DNA polymerase large fragment (from New England Biolabs), 2.5 uL of 10X Thermopol reaction buffer (consisting of 20 mM Tris-HCl, 10 mM KCl, 10 mM (NH4)2SO4, 2 mM MgSO4, and 0.1% Tween 20), 1ul of DNA template, and the volume was adjusted to 25 uL with nuclease-free water.
A typical positive PSR assay produced a multiple band scale on a colored agarose gel, resulting from a simultaneous extension of the DNA polymerase. To analyze the PSR reaction product, the product was purified with a DNA purification kit, and digested with the PvuI restriction enzyme cutting sites found in the original sequence. The result showed that the product was digested and formed a single fragment. At the same time, SYBR green has been added into the reaction mix. SYBR Green can bind to double-stranded DNA by emitting green fluorescence. After the end of the reaction, 1 uL of SYBR Green diluted 1:1000 was added to PSR products. A bright green color indicated positive amplification.
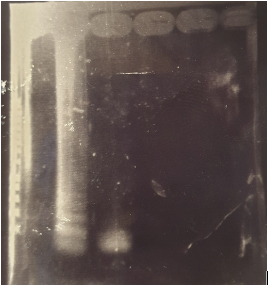
Figure A: Agarose gel electrophoresis of PSR products (From left to right)
Well 1 : Molecular size marker.
Well 2 : PSR amplification products.
Well 3 : PSR amplification products digested by PvuI.
Results
Specificity test for M. smegmatis
To test the specificity of our test for M. smegmatis we used 18 bacteria: mycobacterium: vitro cholera, Lactobacillus lactose, Listeria monocytogenes, Burkholderia cenocepacia, Acinetobacter baumannii, E.coli 0157 H7, Salmonella typhimurium, Xenorhabdus nematophila, Caulobacter crescentus, Corynebacterium olae, Photorhabdus luminescens, Xanthomanos citri, Streptococcus mutans. Results are shown in the figure B. Positive results were obtained for M. smegmatis, Listeria monocytogenes and Burkholderia cenocepacia, demonstrating that our test had an average specificity for M. smegmatis.
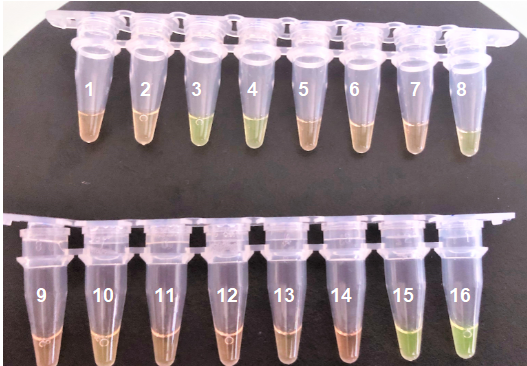
Figure B: Visual detection of negative and positive results of PSR amplification products (1) Vibrio cholerae,(2) Lactobacilus lactis, (3) Lysteria monocytogenes, (4) Burkholderia cenocepacia, (5) Acinetobacter baumannii,(6) E. coli 0157 H7, (7) Salmonella typhimurium,(8) Xenorhabdus nematophila, (9) Caulobacter crescentus, (10) Corynebacterium olae, (11) Photorhabdus luminescens, (12) Xanthomonas citri, (13) Streptococcus mutans (14) Water (negative control), (15-16) M. smegmatis (Positive control).
Detection limit for M. smegmatis
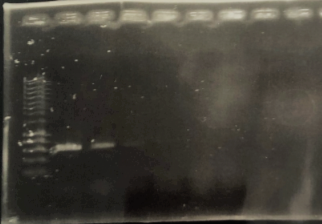
To test the detection of the test for the test for M. smegmatis, we used genomic DNA of M. smegmatis as a test object, and performed a series of 10-fold dilutions of the solution of total DNA, generating nucleic acid concentrations of 10^5 to 10 copies. The test was made with distilled water as a negative control. The results, as shown in FIG, indicate that the detection limit (LD) was 10^2 copies/µl. The limit of detection was also measured by PCR for the same DNA concentrations. The PCR products were separated by agarose gel electrophoresis and stained with red gel. The gels were viewed using the Gel Doc system. The results, as shown in FIG. indicate that the detection limit was 10^2 copies/µl. The sensitivity of the PSR test for the detection of M.smegmatis was substantially equal to that of the test of polymerase chain reaction, based on gel electrophoresis results, agarose and the color change detected with the naked eye.
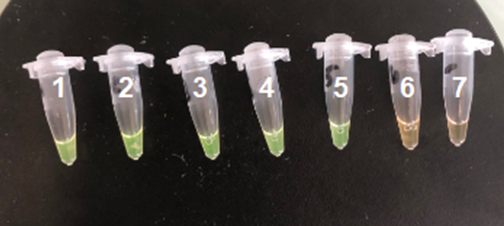
Figure C: Results of the limite of detection for Mycobacterium smegmatis The nucleic acids concentrations into those tubes 1-5 was respectivly de 10^6< copy / µL, 10^5 copy / µL, 10^4 copy / µL, 10^3< copy/ µL, 10^2< copies / µL, 100 copies / µL. The tube 6 have been maintained as a negative control.
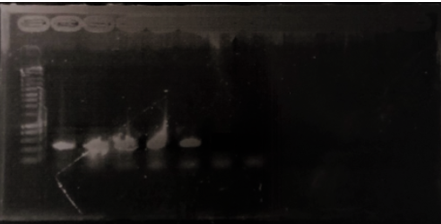
Figure D: Agarose gel elctrophoresis of PCR product. Well 1 : Size Marker Smart ladder. Well 2 : 10^5 copies / µL. Well 3 : 10^4 copies / µL. Well 4 : 10^3 copies / µL Well 5 : 100 copies / µL. Well 6 :10 copies / µL. The Well 7 have been maintained as negative control. Theoretical size : 598 bp.
Specificity test for M. tuberculosis
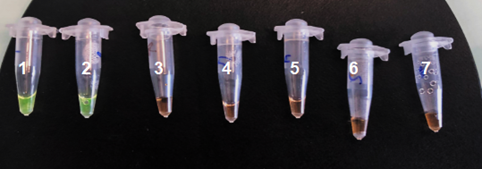
To test the specificity of our test for M. tuberculosis, we used 19 bacteria Vibrio cholerae , Lactobacilus lactis, Listeria monocytogenes, Burkholderia cenocepacia, Acinetobacter baumannii, E.coli 0157 H7, Salmonella typhimurium, Xenorhabdus nematophila, Caulobacter crescentus, Corynebacterium olae, Photorhabdus luminescens, Xanthomonas citri, Streptococcus mutans, Bacteroides fragiles, Mycobacterium avium, Mycobacterium marinum, Mycobacterium smegmatis, a BCG strain, Mycobacterium abscessus and M. tuberculosis (positive control). We used water as a negative control.
Results are shown in the figures E and F. We have positive (green tubes) results with M. tuberculosis and the BCG strain.
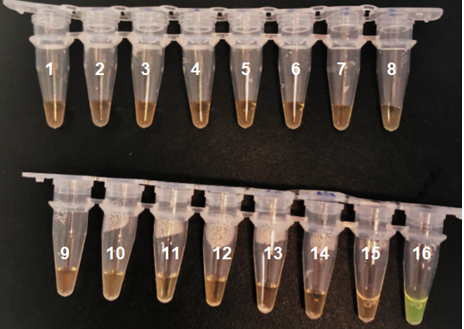
Figure E: Results of the specificity test of M. tuberculosis (1) Vibrio cholerae,(2) Lactobacilus lactis, (3) Lysteria monocytogenes, (4) Burkholderia cenocepacia, (5) Acinetobacter baumannii,(6) E. coli 0157 H7, (7) Salmonella typhimurium',(8) Xenorhabdus nematophila, (9) Caulobacter crescentus, (10) Corynebacterium olae, (11) Photorhabdus luminescens, (12) Xanthomonas citri, (13) Streptococcus mutans, (14) Bacteroides fragiles, (15) Water (C-), (16) M. tuberculosis (C+).
Figure F: Specificity tests of M. tuberculosis (1) M. tuberculosis, (2) BCG strain, (3) M. avium, (4) M. marinum, (5) M. smegmatis,(6) M. abscessus.
Detection limit for M. tuberculosis
To test the detection limit of the procedure, we used the genomic DNA of M. tuberculosis as a test object, and performed a series of 10-fold dilutions the total DNA solutions. We generated nucleic acid concentrations of 10^5 to 10 copies. The test was made with distilled water as a negative control. The results as shown in Figure G. It indicates that the detection limit (LD) was 10^2 copies/µL. The limit of detection was also measured by PCR for the same DNA concentrations. The PCR products were separated by agarose gel electrophoresis and gel-stained red. The gels were visualized. The results, as shown in figure G indicate that the detection limit was 10^2 copies/µL.
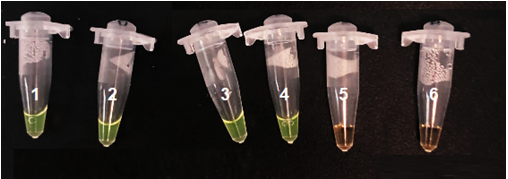
Figure G: Detection limit test for M. tuberculosis. The nucleic acids concentrations into the tube 1-5 were respectivly at 10^5 copies / µL, 10^4 copies / µL, 10^3 copies / µL, 10^2 copies / µL, 10^1 copies / µL. Tube 6 serve as a negative control.
Figure H: Agarose gel electrophoresis for PCR products. (From left to right). Well n°1 : molecular marker. Well n°2 : 10^6 copies / µL. Well n°3 : 10^5 copies / µL. Well n°4 : 10^4 copies / µL Well n°5 :10^3 copies / µL. Well n°6 :10^2 copies / µL. Well n°7 : 10 copies / µL. The well n°8 serves as a negative control. Theoretical size: 432 bp
Amylase
Sputum amylase is a polypeptide chain of 511 amino acids and encoded by an the amy1 gene located on Human chromosome 1.
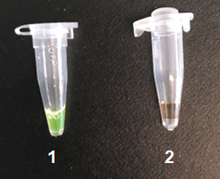
Figure I: PSR test of the amy1 gene (1) Saliva DNA extract, (2) Water (Negative control)
References
- Development and application of a rapid Mycobacterium tuberculosis detection technique using polymerase spiral reaction. Wei Liu, Dayang Zou, Xiaoming He, Da Ao, Yuxin Su, Zhan Yang, Simo Huang, Qinghe Zhao, Yue Tang, Wen Ma, Yongfeng Lu, Jing Wang, Xinjing Wang & Liuyu Huang. Scientific Report.
- Polymerase Spiral Reaction (PSR): A novel isothermal nucleic acid amplification method. Wei Liu, Derong Dong, Zhan Yang, Dayang Zou, Zeliang Chen, Jing Yuan & Liuyu Huang. Scientific Report
- Polymerase spiral reaction (PSR): a novel, visual isothermal amplification method for detection of canine parvovirus 2 genomic DNA. Vikas Gupta,Soumendu Chakravarti, Vishal Chander, Saurabh Majumder,Shabir Ahmad Bhat, Vivek Kumar Gupta,Sukdeb Nandi
- Rapid detection of Pseudomonas aeruginosa targeting the toxA gene in intensive care unit patients from Beijing, China. Derong Dong, Dayang Zou, Hui Liu, Zhan Yang, Simo Huang, Ningwei Liu, Xiaoming He, Wei Liu and Liuyu Huang1
- Helix loop-mediated isothermal amplification of nucleic acids. Rui Mao, ab Lifei Qi,ab Zhuo Wang, Hongtao Liu ac and Yuguang Du.
- Rapid visual isothermal nucleic acid-based detection assay of Brucella species by polymerase spiral reaction. A. Das , B. Kumar, S. Chakravarti , C. Prakash , R.P. Singh, V. Gupta , K.P. Singh , R.K. Agrawal , V.K. Chaturvedi , Abhishek and G. Shrinet
- Novel polymerase spiral reaction assay for the visible molecular detection of porcine circovirus type 3. Jun Ji , Xin Xu , Xueyu Wang, Kejing Zuo , Zhili Li , Chaoliang Leng , Yunchao Kan , Lunguang Yao and Yingzuo Bi
- Takahashi, T. et al. Nested polymerase chain reaction for assessing the clinical course of tuberculous meningitis. Neurology. 64, 1789–1793 (2005).
- Rapid molecular detection of tuberculosis and rifampin resistance. Boehme CC1, Nabeta P, Hillemann D, Nicol MP, Shenai S, Krapp F, Allen J, Tahirli R, Blakemore R, Rustomjee R, Milovic A, Jones M, O'Brien SM, Persing DH, Ruesch-Gerdes S, Gotuzzo E, Rodrigues C, Alland D, Perkins MD.
- Evaluation of the analytical performance of the Xpert MTB/RIF assay. Blakemore R1, Story E, Helb D, Kop J, Banada P, Owens MR, Chakravorty S, Jones M, Allan
Transcription Activator-Like (TALs)
We used the TALs proteins and linked them to a chromoprotein. The complex recognizes the PSR product. The complex is the main detection component of our procedure.
TAL2 production
We were able to insert the TAL2 gene into a plasmid containing the T7 promoter and RBS which is a psB1C3 vector. SDS-PAGE was performed and stained with Coomassie blue using cells containing this Biobrick, to verify the production of our protein we did different growing conditions to determine the best growing conditions by using two types E. coli bacteria :
- E. coli K-12 DH5-alpha
- BL21 DE3
Figure 1. SDS-PAGE of the production in E. coli K-12 DH5-alpha of TAL, well 1, 2 and 3 are not induced of TAL1, TAL2 clone1 and TAL2 clone2, respectively. Well 4, 5 and 6 are induced at 30°C with 0.1M IPTG of TAL1, TAL2 clone1 and TAL2 clone2, respectively.
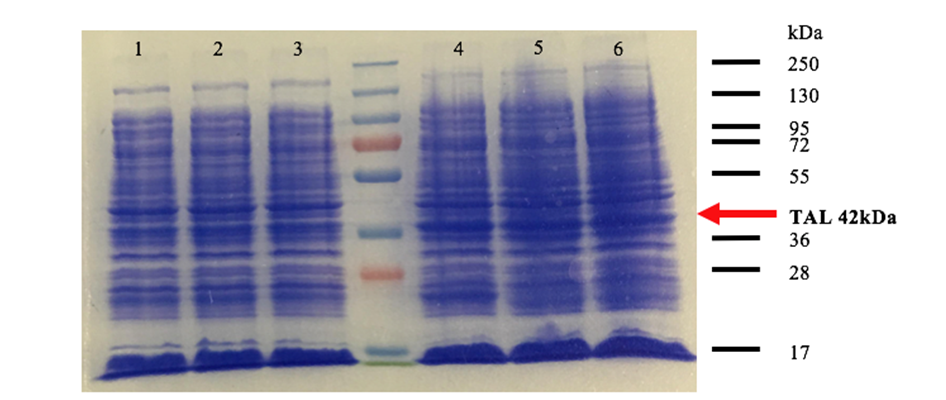
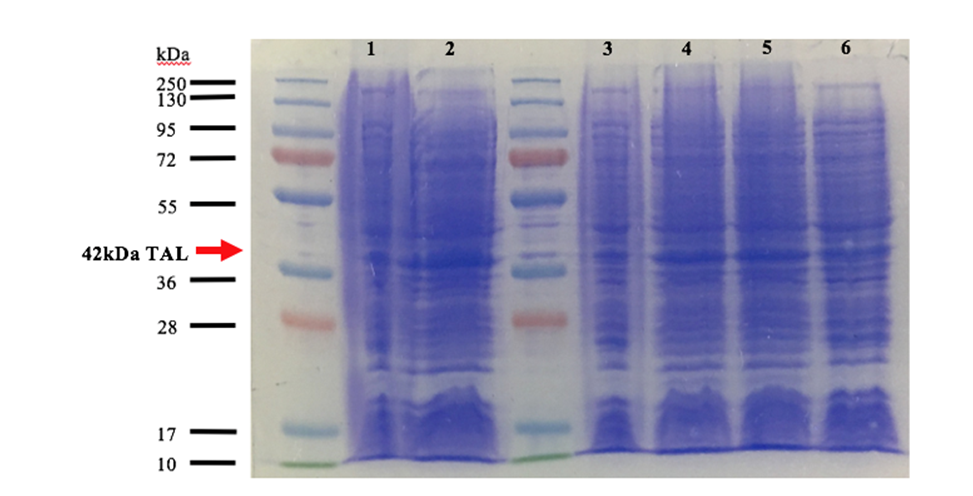
Fig 2. SDS-PAGE of the production in BL21 DE3 of TAL. Well 1, 3 and 5 are induced at 30°C with 0.1M IPTG for 3 hours of TAL1, TAL2 clone1 and TAL2 clone2, respectively. Well 2,4 and 6 are induced at 16°C with 0.1M IPTG overnight.
We used 2 different strains of E. coli Dh5 alpha, and a BL21 strain. There are bands at approximatively 42kDa, that correspond to TAL2 molecular weight that was engineered. After analyzing these results, the induction condition at 0.1M IPTG at 30 ° C is chosen for the rest of the experiments. As we can see wither our protein are amplify overnight or for 3hours theirs the same quantity of protein that are produced, and wither our protein were produced in BL21 DE3 or DH5a theirs also the same amount of protein that are produced. So, we choose to use the proteins that was produced overnight in BL21 DE3.
TAL2 purification
After having realized the TAL2 production tests, the purification was realized in order to obtain pure protein fractions. For this, the E. coli BL21 cells were lysates and then are purified. Purification of the protein was realized with a HisTag column which is a manual chromatography system for quick, easy ad small quantity purification. The fusion of the histine tag with TAL2 allows to separate our protein from the other proteins. To confirm that the elution corresponds to the TAL2, a Western Blot of the fractions corresponding to the elution as well as the non-retention is realized (Fig.3). The deposit on the SDS-PAGE of the no-retained fraction allows to check if our has been retained on the column.
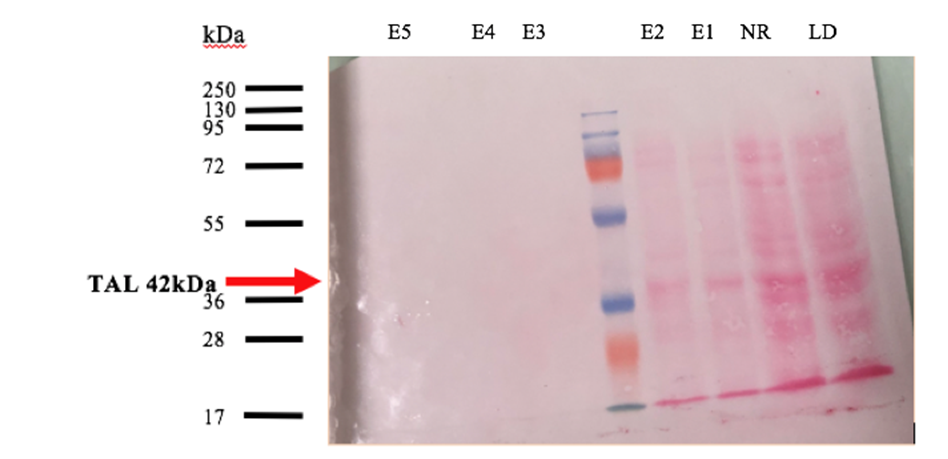
Fig 3. Western Blot analysis of TAL2 after purification with HisTag column. LD= loading sample, NR= non-restraint, E1 to E5 correspond to the eluted fractions.
After Western Blot visualization (fig. 3), the histidine tag allows to purify our protein from the other proteins. Red Ponceau staining was use on this Western Blot, which conclude why the bands at E3, E4 and E5 are not intense, because Ponceau staining are specific to our protein. An intense band is observable approximately 42 kDa corresponding to TAL2. However, the 42kDa band is observable in the no-restrained, it means that there was too much protein and the used column saturated with our sample. After purification, a pool of fractions was done. Now that the protein is purified, an activity test is done to check if the TAL2 has a high affinity for the DNA amplify.
TAL2 activity test
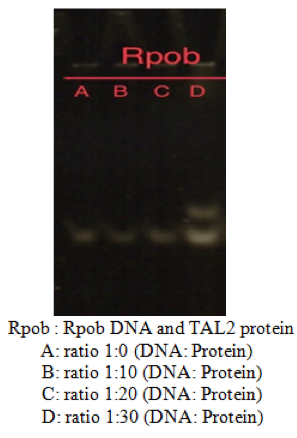
To verify the functionality of this part we did an electrophoretic mobility shift assay (EMSA) also none as a gel shift assay, which is a method that’s able to analyze the potential interaction protein-DNA. We used the gel shift assay in order to study our proteins for the respectively targeted DNA amplicons.
Fig 4. Activity test of TAL2 in the presence/absence of the DNA amplify Lane A is a negative control containing only the genetic material. The other lanes are an increase of the quantity of our proteins in contact with the same quantity of DNA amplify. TAL2 were designed to target the rpoB gene that are amplify PSR using two specific primers, which is a gene that’s present in Tuberculosis. Lane B and C contains 10 to 20 times more of proteins TAL2 than DNA amplify, there isn’t no shift visible. Lane D of rpoB there is a partial gel shift with a ratio of 1:30, meaning that there were serval TAL2 that was able to fixate itself of to the DNA amplify.
Conclusion and discussion
The protein TAL2 was design in order to recognize a specific sequence on the rpoB gene in M.Tubercolosis (5’ CCGCTG 3’). This engineered TAL consist of repeat domain has a primary structure with two amino acids that differs in each domain, those two amino acids are a code for one nucleotide of the binding sequence selected. The SDS-PAGE (Fig 2) and Western Blot (Fig 3) show that our protein was well produced and purified, which allowed us to do an activity test.
The gel shift assay, shows the activity test of the different ratio of TAL2 in the presence of the same amount of DNA rpoB. There was a partial band shift (Fig.4D) present on the gel, which may be due to the insufficient quantity of protein TAL2 present. Thanks to the presence of this shift band allows to justify the fixation of TAL2 on rpoB gene with a ratio of 1:30, and the intensity of the shift shows approximately 30-40% of TAL2 were able to bind itself on to the gene.
Perspectives
Two more test can be done. Firstly, the fixation of TAL2 needs improvements. By testing more ratio of TAL2 in the presence of rpoB gene. Secondly, the activity test needs to be done for the two other TALs (TAL1 and TAL3).
Antifreeze proteins (AFPs) protects certain cold-adapted organisms from freezing to death by selectively adsorbing to internal ice crystals and inhibiting ice propagation. We were able to produce and purified the Choristoneura fumiferana (Spruce budworm moth) (Archips fumiferana) AFP-Iu1 A family of expressed antifreeze protein genes from the moth, Choristoneura fumiferana.
AFP-lu1 production
We were able to insert the AFP-lu1 gene into a plasmid containing the T7 promoter and RBS which is a psB1C3 vector. SDS-PAGE was performed and stained with Coomassie blue using cells containing this Biobrick, to verify the production of our protein we did different growing conditions to determine the best growing conditions by using two strains of E.coli bacteria :
- DH5α
- BL21 DE3
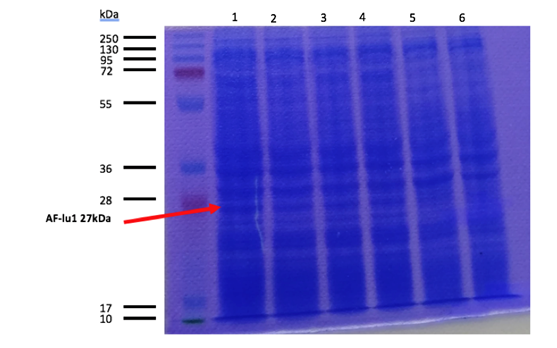
Figure 1. SDS-PAGE of the production in DH5a and BL21 DE3 of AF-lu1, well 1 and 2 are induced at 30°C with 0.1M IPTG for 3hours in DH5a and BL21 DE3, respectively. Well 5 and 6 are not induced of AF-lu1 in DH5a and BL21 DE3 respectively. Well 3 and 4 are induced at 16°C with 0.1M IPTG overnight in DH5a and BL21 DE3, respectively.
We used 2 different strains of E. coli Dh5 alpha, and a BL21 strain. There are bands at approximatively 27kDa, that correspond to AF-lu1 molecular weight that was engineered. After analyzing these results, the induction condition at 0.1M IPTG at 30 ° C is chosen for the rest of the experiments. As we can see wither our protein are amplify overnight or for 3hours theirs the same quantity of protein that are produced, and wither our protein were produced in BL21 DE3 or DH5a theirs also the same amount of protein that are produced. So, we choose to use the proteins that was produced overnight in BL21 DE3.
AFP-lu1purification
After having realized the AFP-lu1 production tests, the purification was realized in order to obtain pure protein fractions. For this, the E. coli BL21 cells were lysates and then are purified. Purification of the protein was realized with a HisTag column which is a manual chromatography system for quick, easy ad small quantity purification. The fusion of the histine tag with AFP-lu1 allows to separate our protein from the other proteins.
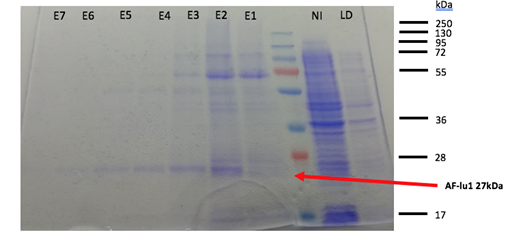
Fig 2. SDS-PAGE of AFP-lu1 after purification with HisTag column.LD= loading sample, NR= non-restraint, E1 to E7 correspond to the eluted fractions.
Fig 3. Western Blot analysis of AFP-lu1 after purification with HisTag column. (a) LD= loading sample, NR= non-restraint, E1 to E3 correspond to the eluted fractions. (b) from E4 to E7 correspond to the eluted fractions.
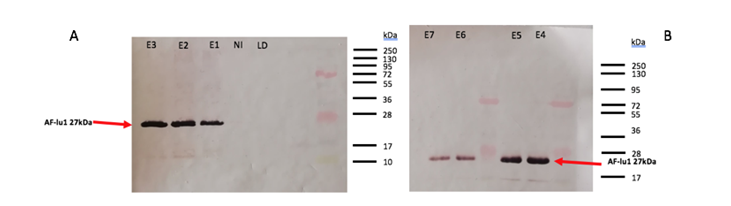
After SDS-PAGE visualization (fig. 2), the histidine tag allows to purify the AFP-lu1 from the total proteins. An intense band is observable approximately 27 kDa corresponding to AFP-lu1. However, the 27kDa band is not observable in the no-restrained, it means that our protein was will held back in the column. After purification, a pool of fractions E3 to E7 is made. The deposit on the SDS-PAGE of the no-retained and loading sample fraction allows to check if our protein has been retained on the column. There isn’t no band at 27kDa of our protein, so our protein has been retained correctly on the column. The fractions from E1 to E7 present a band at 27kDa, our protein was eluted. To confirm the elution corresponding to the AFP-lu1, a Western Blot of the fractions corresponds to the elution, flow-through, as well as the loaded sample was realized (Fig.3). In the Well LD and NI there isn’t no band at 27kDa, which confirms that our protein was well retained on the column and in the fraction E1 to E7 present a band. The presence of each band shows the release of our protein. The HisTag on our protein allows the fixation of the primary antibodies and the second antibodies are used to give the color of the band. Now that the protein is purified, an activity test was able to be realized but there was no more time to finish.
We amplify of the NlaIII and HhaI, DNA sequence with the oligo OGC35/36. After the amplification and the DNA clean up of gene blocks fragments that we received by IDT. We amplified these DNA fragments with the primers containing the floating tail. Each fragment have been amplified with different specific oligo that we designed. The agarose gel electrophoresis 1%. We carry out a PCR DNA clean up in all PCR products that we obtained. A digestion of the Psb1c3 have been made with de EcoRI and PstI restriction enzymes, and have been used to performed a SLIC with these NlaIII-Linker/CDB-Linker and HhaI-Linker/ CDB-Linker. After doing a bacterial transformation, we obtained colonies on which we realized PCR colony. The results are shown below

Figure 1 : We see two bands that seem higher than when we have only methylases, which tells us that methylases are well linked with CBD. We can see a slight shift of methylases towards higher molecular weight, which accounts for the binding between the methylases and the cbd.

Figure 2 : this Slic means good. We see that the molecular weight is good and it is a succession of methylase, in the well 1 we have the molecular weight scale then the well 2 is the NlaIII-M methylase and the well 3 is HhaI-M. then, then, between the two methylases, some wells work more than others.
The prefix and the suffix oligos have been designed to carry out PCR amplification. These oligos are suitable for all the proteins constructions of TolA3-CBD and the Green chromoprotein-P3-N1. The 3’end of Cellulose binding domain (called CBD) primer was chosen in order to amplifiy the protein sequence by adding a binder at the 3’ end. To bind both proteins, a binder was placed on the oligo 5’ of TolA3 DNA fragment. This oligo is complementary of the binder presented on the 3’ part of the chromoprotein oligo. This makes it possible to create a chimeric TolA3 protein coupled to the CBD. The 3’end of Green chromoprotein primer was chosen in order to amplifiy the protein sequence by adding a binder at the 3’ end. To bind both proteins, a binder was placed on the oligo 5’ of g3p DNA fragment (called P3-N1 protein). This oligo is complementary of the binder presented on the 3’ part of the chromoprotein oligo. This makes it possible to create a chimeric P3-N1 protein coupled to the Green chromoprotein.
We amplify of the P3-N1, TolA3, CBD, and Green chomoprotein DNA sequence with the oligo OGC35/36. After the amplification and the DNA clean up of gene blocks fragments that we received by IDT. We amplified these DNA fragments with the primers containing the floating tail.. Each fragment heve been amplified with different specific oligo that we designed. The agarose gel electrophoresis 1% is shown below.
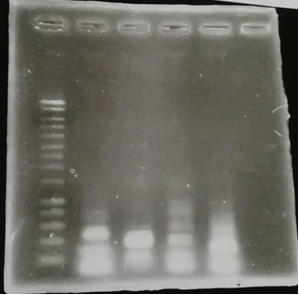
Figure 1 : Agarose gel electrophoresis of the PCR products
- Well1 : Size marker (smart Ladder)
- Well2 : TolA3 DNA fragment with the linker (floating tail)
- Well3 :P3-N1 DNA fragment with the linker (floating tail)
- Well4 : CBD DNA fragment with the linker (floating tail)
- Well5 : Green chromoprotein DNA fragment with the linker (floating tail)
We can see that all DNA fragments have been amplified, suggesting that the most of DNA fragments have received the binder.
We carry out a PCR DNA clean up in all PCR products. A digestion of the Psb1c3 have been made with de EcoRI and PstI restriction enzymes, and have been used to performed a SLIC with these TolA3-Linker/CDB-Linker and P3-N1-Linker/Green chromoprotein-Linker. After doing a bacterial transformation, we obtained colonies on which we realized PCR colony. The results are shown below
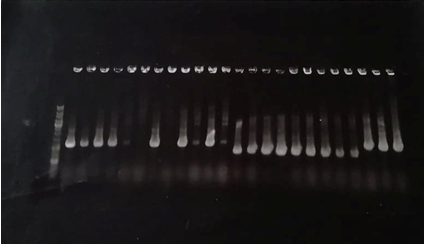
Figure 2 : Agarose gel electrophoresis of the PCR colonies products
- Well1 : Size marker (DNA Ladder)
- Well2 to 13: TolA3-CBD DNA fragment
- Well 14 to 25 : Green chromoprotein-P3-N1 DNA fragment
The TolA3-CBD construct should theoretically contain 783 base pairs. The results of the electrophoresis gel show Tol-CBD constructs around 800 bp while the P3-N1-chromoprotein constructs have sizes of about 600 base pairs. The sequencing results showed that the P3-N1-Green chromoprotein constructs did not exhibit any protein sequence encoding the fusion protein. Only the presence of mRFP was demonstrated during sequencing. The results of the sequencing, however, showed the presence of CBD in the Psb1C3 vector from the TolA3-CBD clones. Multiple alignment verification (MUSCLE) confirmed the presence of the coding sequence for the TolA3-CBD fusion protein in plasmid pSB1C3.
Digestion verification by agarose gel electrophoresis
We’ve digested 3 plasmides of the clones TolA3-CBD with two differentes restriction enzyme such as EcoR-HFI and PstI-HF .We carry out three differents digestions for each sample, in order to verifyy the persence of the insert in the plasmid and to test the restrictions enzymes activities. The digestion have been carry out for 1.30 hour at 37°C.
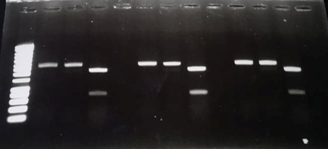
Figure 3 : Digestion verification of the TolA3-CBD clones by agarose gel electrophoresis
- Well 1 : Size marker (smart Ladder)
- Well 2, 6 and 10: pSB1C3 with TolA3-CBD insert which have been digested by EcoRI-HF.
- Well 3, 7 and 11: pSB1C3 with TolA3-CBD insert which have been digested by PstI-HF.
- Well 4, 8 and 12: pSB1C3 with TolA3-CBD insert which have been disgested by both restrictions enzymes (EcoRI-HF and PPstI-HF).
The results showed that all the clones tested contained the ToLA3-CBD insert within the Psb1c3 plasmid. The DNA fragments obtained around 2000 base pairs correspond to the linear psb1c3 plasmid whereas the bands located around 800 base pairs correspond to the TolA3-CBD insert.
P3-N1/chromoprotein constructions
We tryed to performed an other SLIC in order to get the P3-N1 /Green chromoprotein construction. After doing a bacterial transformation, we obtained colonies on which we realized PCR colony. The results are shown below
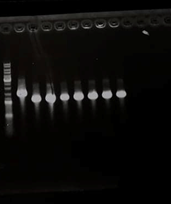
Figure 4 : Agarose gel electrophoresis of the PCR colonies products
- Well1 : Size marker (DNA Ladder)
- Well2 to 8: Green chromoprotein-P3-N1 DNA fragment
The Green chromoprotein-P3-N1 construct should theoretically contain 1041 base pairs. The results of the electrophoresis gel show that the Green chromoprotein/ P3-N1 is around 1000 base pairs. The results of the sequencing showed the presence of Green chromoprotein in the Psb1C3 vector from the Green chromoprotein/ P3-N1 clones. Multiple alignment verification (MUSCLE) confirmed the presence of the coding sequence for the Green chromoprotein/ P3-N1 fusion protein in plasmid pSB1C3.
- The day before the preparation, make overnight starters with an isolated colony on an agar plate in 5 mL of LB in a 50 mL Erlenmeyer.
- Prepare buffers 1 and 2 and put them on ice. Put Eppendorf tubes and pipette tips at -80°C for future use.
- The next day, recover your starters and seed 1/100 of bacterial cells in 200mL of LB, then incubate at 37°C and 180rpm.
- Keep measuring the OD600. When it’s between 0.4 and 0.6, recover your cells and pool them in cold 50 mL Falcon tubes.
- Centrifuge tubes at 4000 rpm and 4°C for 10 minutes.
- Discard supernatant and resuspend each Falcon tube in 20 mL of buffer 1. Afterward, centrifuge at 3500 rpm and 4°C for 5 minutes.
- Discard supernatant and resuspend each Falcon tube in 8 mL of buffer 2.
- Take 100 μL aliquots in Eppendorf tubes and stock them at -80 °C.
| Product | For 40 mL |
|---|---|
| KAc (1M) | 1.2mL |
| MnCl2 (0.5M) | 4 mL |
| KCl (1M) | 4 mL |
| CaCl2 (0.1%) | 4 mL |
| Glycerol (80%) | 7.5 mL |
| H2O | 19.3 mL |
| Product | For 8,5 mL |
|---|---|
| KCl (1M) | 80µL |
| MOPS (1M) | 400 µL |
| CaCL2 (0,1M) | 6mL |
| Glycerol (80%) | 1,5 mL |
| H2O | 500 µL |
- Recover the right amount of competent cells tubes An tube serves as a negative control.
- Recover 50-100µL of competent cells.
- Add DNA (1-2µL) into the competent cells.
- Incubate on ice for 20 minutes.
- Incubate tube at 42°C for 1 minute for thermal choc.
- Leave tubes on ice for 5 minutes.
- Add 900 µL of LB (Lysogeny broth) per tube, then incubate for 1 hour at 37°C and 850rpm.
- Centrifuge tube for 5 minutes at 4000rpm at RT. Get rid of 900µL of supernatant.
- Resuspend and spread cells on Petri dishes with the desired antibiotic and incubate overnight at 37°C.
| Product | For 30 µL |
|---|---|
| DNA | depend on the DNA concentration |
| 10X buffer | 3 µL |
| Restriction enzyme 1 | 0.3 µL |
| Restriction enzyme 2 | 0.3 µL |
| MiliQ water | To 30 µL |
Incubate 3 hours at 37°C Do a DNA clean up (protocole à ajouter)
| Product | For 20 µL |
|---|---|
| Vector | depend on the vector concentration |
| Insert | use NEBcalculator (ratio 3:1) |
| T4 10X buffer | 2 µL |
| T4 DNA ligase | 1 µL |
| MiliQ water | To 20 µL |
Incubate 2 hours at room temperature (or overnight at 16°C)
| Components | For 25 uL | Final concentration |
| Bst DNA polymerase | 1 ul | 320 U/ml |
| dNTPs (10mM) | 3,5 ul | 1.4 mM each |
| Thermo Pol buffer 10X | 2,5 ul | 1X (contains 2 MgSO4) |
| Forward Primer | 1 ul | 1.6 uM |
| Reverse Primer | 1 ul | 1.6 uM |
| MgSO4 | 1,5 ul | 6mM (8mM total) |
| DNA sample | Variable (1ul) | >10 copies |
| Betain (10 M) | 1,5 ul | 0,6 M |
| Nuclease free water | To 25 ul | |
| Total Reaction Volume | 25 ul |
All centrifugation steps are done at ~13000 rpm in a typical microcentrifuge. This ensures that all traces of buffer are eluted at each step.
1. A starting sample volume of 50 μL is recommended. For smaller samples, nuclease-free water can be used to adjust the volume. Add 100 μL DNA Cleanup Binding Buffer to the 50 μL sample.
2. Insert a column into a collection tube, load sample onto the column and close the cap. Spin for 1 minute, then discard flow-through.
3. Re-insert column into the collection tube. Add 200 μL DNA Wash Buffer and spin for 1 minute. Discard flow-through.
4. Repeat Step 3. This step is recommended for removal of enzymes that may interfere with downstream applications.
5. Transfer column to a clean 1.5 ml microfuge tube. Use care to ensure that the tip of the column does not come into contact with the flow-through. If in doubt, re-spin for 1 minute to ensure traces of salt and ethanol are not carried over to the next step.
6. Add ≥ 15 μL of hot water (70°C) to the center of the matrix. Wait for 1 minute, then spin for 1 minute to elute the DNA.
7. Repeat step 6.
All centrifugation steps are done at ~13000 rpm in a typical microcentrifuge. If precipitate has formed in Lysis Buffer (B2), incubate at 30–37°C, inverting periodically to dissolve. Store Plasmid Neutralization Buffer (B3) at 4°C after opening.
1. Pellet 1–5 mL bacterial culture (not to exceed 15 OD units) by centrifugation for 30 seconds. Discard supernatant.
2. Resuspend pellet in 200 μL Plasmid Resuspension Buffer (B1) (pink). Vortex or pipet to ensure cells are completely resuspended. There should be no visible clumps.
3. Lyse cells by adding 200 μL Plasmid Lysis Buffer (B2) (blue/green). Invert the tube immediately and gently 5–6 times until color changes to dark pink and the solution is clear and viscous. Do not vortex! Incubate for 5 minutes.
4. Neutralize the lysate by adding 400 μL of Plasmid Neutralization Buffer (B3) (yellow). Gently invert tube until the color is uniformly yellow and a precipitate forms. Do not vortex! Incubate for 2 minutes.
5. Clarify the lysate by spinning for 10 minutes at ~13000pm.
6. Carefully transfer supernatant to the spin column and centrifuge for 1 minute. Discard flow-through.
7. Re-insert column in the collection tube and add 200 μL of Plasmid Wash Buffer 1. Plasmid Wash Buffer 1 removes RNA, protein, and endotoxin. Centrifuge for 1 minute. Discard flow-through.
8. Add 400 μL of Plasmid Wash Buffer 2 and centrifuge for 1 minute.
9. Centrifuge for 1 minute one more time.
10. Transfer column to a clean 1.5 mL microfuge tube. Use care to ensure that the tip of the column has not come into contact with the flow-through. If there is any doubt, re-spin the column for 1 minute before inserting it into the clean microfuge tube.
11. Add ≥ 15 μL Hot Water (70°C) to the center of the matrix. Wait for 1 minute, then spin for 1 minute to elute DNA.
12. Repeat step 11.
Production
1. Prepare 6 starters (20 mL LB and chloramphenicol): control BL21 (No plasmid), BL21 with the plasmid in duplicates, control DH5α (No plasmid), and DH5α with the plasmid in duplicates. Incubate overnight at 37°C and 180 rpm.
2. The next day, recover the overnight starters and measure the OD600.
3. Make 1/60 dilutions and incubate at 37°C to reach 0.7 in OD600.
4. Add (For one of the duplicates) IPTG (1M) (10µL for 20 mL) to induce the protein production in BL21 and DH5α with the plasmid.
5. Incubate at 16°C, 30°C, and 37°C for 5 hours.
6. Leave the remaining cultures at 37°C for 5 hours. Incubate the cultures at 16°C overnight.
7. After 5 hours, measure the OD600 and take 1 mL aliquots.
8. Centrifuge aliquots for 10 minutes at 13000 g. Discard supernatant and stock samples at -20°C.
9. For the remaining cultures, pour the remaining volumes into 50 mL Falcon tubes and centrifuge for 20 minutes at 4700 g and 4°C. Discard supernatant and stock samples at -20°C.
10. The next day, measure the OD600 of the culture at 16°C, take 1 mL aliquots, then repeat steps 8 and 9.
Electrophoresis gel migration
1. Add TSTD (1X) at 50 µL/OD unit to the 1 mL aliquots. Do not resuspend.
2. Put samples in the dry bath incubator for 20 minutes
3. Prepare the migration apparel and charge the gel (20 µL for samples, and 5 µL for the ladders).
4. Start migration at 0.04 A for an hour.
5. Incubate gels in Coomassie blue for an hour.
6. Wash gels with acetic acid till they're transparent.
7. Once the gel is clear, add ddH2O and stock at 4°C.
Cell lysis and protein extraction
1. Prepare a 1L starter cell cultures and incubate at the optimal conditions tested out during the first protein production.
2. Centrifuge for 20 minutes at 4500 rpm and 4°C . Discard supernatant.
3. Resuspend pellet in a lysis buffer (50 mM Tris-HCl (pH=8), 50 mM NaCl, 1 mM EDTA, 0.1 mg/L DNase, and an anti-protease tablet).
4. Put on agitator for 30 minutes at 4°C .
5. Disrupt the cells using the emulsiflex.
6. Ultracentrifuge for 35 minutes at 20000 rpm and 4°C .
7. Transfert supernatant into 50 mL Falcon tubes and discard pellets.
His-tag Protein purification
1. The purification uses the ÄKTA pure system with HisTrap™ columns.
2. Wash the column with 5 H2O volumes to eliminate all ethanol.
3. Wash the column with 5 buffer A (50 Mm Tris-HCl (pH=8), 50 mM NaCl) volumes.
4. Inject the supernatant from the protein extraction in the HisTrap™ column. Discard flowthrough.
5. Elute the column with 10 buffer A volumes. Discard flowthrough.
6. Using a 0 to 100% gradient, elute the column with buffer B (Buffer A + 500 mM imidazol). Collect flowthrough gradually in 1 mL fractions.
7. Recover the collected fractions and verify the purification on a SDS-PAGE gel.
8. Quantify the purified protein on the NanoDrop.
Protein purification by ion exchange column
The purification uses the ÄKTA pure system system with anion exchange columns.
1. Wash the column with 5 H2O volumes to eliminate all ethanol.
2. Wash the column with 5 buffer A (50 Mm Tris-HCl (pH=8), 50 mM NaCl) volumes.
3. Inject the supernatant from the protein extraction in the column. Collect flowthrough.
4. Elute the column with 10 buffer A volumes. Collect flowthrough.
5. Using a 0 to 100% gradient, elute the column with buffer B (50 Mm Tris-HCl (pH=8), 1 M NaCl). Collect flowthrough gradually in 1 mL fractions.
6. Recover the collected fractions and verify the purification on a SDS-PAGE gel.
7. Quantify the purified protein on the NanoDrop.
Preparing a SDS-PAGE gel (4 gels recipe)
The SDS-PAGE gel has two main composites: a stacking gel and a separation gel. The following table shows the recipe to prepare them. When putting them in the plaques pool the separation gel before the stacking gel, and leave to dry for 15 minutes.
| Product | Stacking | Separating gel |
|---|---|---|
| Acrylamid | 600 µL | 6.25µL |
| Tris-HCl (3M, pH=8.8) | 2.64 mL | - |
| Tris-HCl (1M, pH=6) | Tris-HCl (1M, pH=6) | 600 µL |
| SDS (10%) | 50 µL | 200 µL |
| APS (10%) | 60 µL | 80 µL |
| TEMED | 5 µL | 10 µL |
When the gel is ready, prepare your samples (Dilute them in TSTD 1X at 50 µL/OD unit), then incubate for 10 minutes at 95°C. Load the gel and run the migration system for 2 hours (10 minutes at 90V and 110 minutes at 120V).
Western blot
1. Setup the migration sandwich: Whatman paper (+), nitrocellulose membrane, gel, Whatman paper (-). Soak in blotting buffer.
2. Put the assembly in the blotting system and run it at 250 mA and 1 minute/kDa.
3. Recover the membrane. Incubate overnight at 4°C or for an hour at RT on agitator (50 opm) in saturation buffer (TBS 1X, Tween20 0.1%, and milk 10%).
4. Wash membrane in washing buffer (TBS 1X and Tween20 0.1%) for 5 minutes at 50 opm. Repeat step two more times.
5. Dilute the primary antibiodies (1/1000) in TBS 1X, Tween20 0.1%, and milk 10%. Incubate membrane overnight at 4°C or an hour at RT and 20 opm.
6. Wash membrane in washing buffer (TBS 1X and Tween20 0.1%) for 5 minutes at 50 opm. Repeat step two more times.
7. Dilute the secondary antibiodies (1/5000) in TBS 1X, Tween20 0.1%, and milk 10%. Incubate membrane overnight at 4°C or for an hour at RT and 20 opm.
8. Wash membrane in washing buffer (TBS 1X and Tween20 0.1%) for 5 minutes at 50 opm. Repeat step two more times.
Procedures
1. Digest vector with restriction enzyme(s) overnight, and purify the inearized vector with commercial PCR purification kit. Elute the DNA with elution buffer or 10 mM TrsCl, pH 8.0-8.5. Do not elute the DNA with water or TE. Measure the concentration of the vector.
2. Amplify your gene of interest by PCR using primers with ≥ 15 mer homolog extension to the linearized vector end. We usally use 15 bp homlogy for single fragment cloning, and 20 bp homology for multiple fragment cloning. Purify the linearized vector with a commerciale PCR purification kit. Elute the DNA with elution buffer or 10 mM TrisCl, pH 8.0-8.5. Do not elute the DNA with watrer or TE. Measure the concentration of the insert(s).
3. Mix thelnearized vector and insert at a molar ratio of 1:2 in a 1:5 mL tube. An example is shown as follows. (Vector to insert molar ratio of : 1:1; to 1:7 works well but we asually use 1:2 for the single fragment cloning, 1:2:2 for multiple fragments cloning. An example of 3 fragment cloning is shown below with vector: insert 1: insert 2 molar ratio is : 1:2:2 as shown.
| Stock concentration | Volume added | Final concentration | |
|---|---|---|---|
| Linearized vectoe (eg,5kb) | 100 ng/µL | 1 µL | 10 ng/µL |
| Insert1 (PCR product, eg, 1kg) | 40 ng/µL | 1µL | 4 ng/µL |
| 40 ng/µL | 1µL | 4 ng/µL | |
| 10X BSA | 1µL | 1X | |
| 10X NEB Buffer 2 | 1µL | 1X | |
| H2O | Up to 10µL |
4. Add 0.5 µL of the T4 DNA polymerase (3 U/µL, NEB) to the mixture and incubate at room temperature for 2.5 min. We found that 0,5 (1,5 U ) of the T4 DNA polymerase gives the best result, but 0.2 µL gives more than sufficient number of colonies.
5. Put the reaction mixture on ice immmediately to stop the reaction and incubate on ice for 10 min.
6. Thaw chamivcally competent E.coli cells on ice for 10 minutes
7. For single fragment clonning, gently mix the cells with 10 µl of the reaction mixture and incubate the cells on ice for 20 min. For multiple fragment cloning, mix the cells with 3-5 µL of the reactants.
8. Incubate he cells on ice for 30 minutes.
9. Heat shock the cells at 40°c for 45 secondes.
10. Incubate the cells on ice for 3 minutes.
11. Add 900 (or 950) µL of LB broth to 100 (or 50) µL of the cells.
12. Incubate the cells at 37°C for 1 hour.
13. Plate the cells on agar plates containing suitable antibiotics (eg, 100 µg/ml amplicillin). We usually spread 10 to 20 µL of the cells onto an agar to get optimal number of colonies per plate for single fragment cloning, and 100 µL per plate for multiple fragments cloning. In case of 10-20 µL spreading, cells needs to be further diluted with 80-90 µL LB broth for suitable spread spreading.
14. Incubate the plates at 37°C for 16 hours and analyze the colonies.
Reactional buffer (conserved at -20°C)
| Stock | 5X | Volume (for 1mL) | |
|---|---|---|---|
| Tris-HCl (pH 7,2) | 1M | 125 mM | 125 µL |
| MgCl2 | 1M | 50mM | 50 µL |
| CaCl2 | 0,1M | 5mM | 50 µL |
| EDTA (pH 8) | 0,5M | 2,5mM | 5 µL |
| KCl | 1M | 250mM | 250 µL |
| Glycerol | 80% | 25% | 300 µL |
| Water | 220 µL |
Acrylamide gel: 10% (29:1) without SDS and without stacking
For 10mL:
- 5,35mL of water
- 3,3mL acrylamide (29:1; 30%)
- 1,25mL Tris pH 8,8 3M
- 100 µL APS 10%
- 6 µL Temed
To be prepared the day before
- Make a pre-run during one hour in TAE 1X at RT and 80V constant
Preparation of the reactional mix (to prepare during the pre-run) DNA: between 50 and 100ng (around 20 nM) : 1µL (to be adjusted slowly) Protein: adjusted depending on ratio Prot/DNA Buffer 5X: 4µL H20: qsp 20
Incubation of samples during 20-30 minutes at 20°C without agitation in thermomix, then whole samples are loaded in the gel Migration during two hours in TAE 1X at RT and 80V Coloration during 10 min in red gel.
| Ratio Protein:DNA | 0 | 10 | 20 | 30 | 40 |
|---|---|---|---|---|---|
| DNA | 1 µL | 1 µL | 1 µL | 1 µL | 1 µL |
| Protein | 0 µL | 1 µL | 2 µL | 3 µL | 4 µL |
| Buffer 5X | 4 µL | 4 µL | 4 µL | 4 µL | 4 µL |
| Water until 20 µL | 15 µL | 14 µL | 13 µL | 12 µL | 11 µL |