Team:Aix-Marseille/Contribution
In order to characterize the aeCP597 protein, we purified it, determined the extinction coefficient and examined the thermal stability.
aeCP597 purification
To purify the aeCP597, we inserted a Histidine tag to aid purification and a T7 promoter to permit expression in E.coli BL21 DE3 under control of the lac operon. Primers were designed to include the XbaI restriction site, a His-Tag in N-ter and to remove the RBS already present in the Biobrick sequence. After PCR amplification, the amplicons were cloned in E.coli DH5α under the T7-RBS Biobrick using the basic iGEM cloning standard.
The protein was expressed in E.coli BL21 DE3. A first test of production was done. The cells were induced by IPTG (1 mM) during 3 hours at 30°C. No color could be seen in the culture. A second test of production was done, but the cells were induced overnight at 16°C. The culture had a blue shade color due to a better protein maturation. This second production was used for the further experiments.
Pellets were resuspended in a lysis buffer (50 mM Tris-HCl (pH=8), 50 mM NaCl, 1 mM EDTA, 0.1 mg/L DNase and an anti-protease tablet). Then, cells were broken by sonication 2 times for 1 minute at 50% efficiency and the clarified lysate loaded onto a HisTrap™ column. The column was washed with buffer A (50 mM Tris-HCl (pH=8), 50 mM NaCl). Using a 0 to 100% gradient, the protein was eluted with buffer B (50 mM Tris-HCl (pH=8), 1 M NaCl) using the ÄKTA pure system
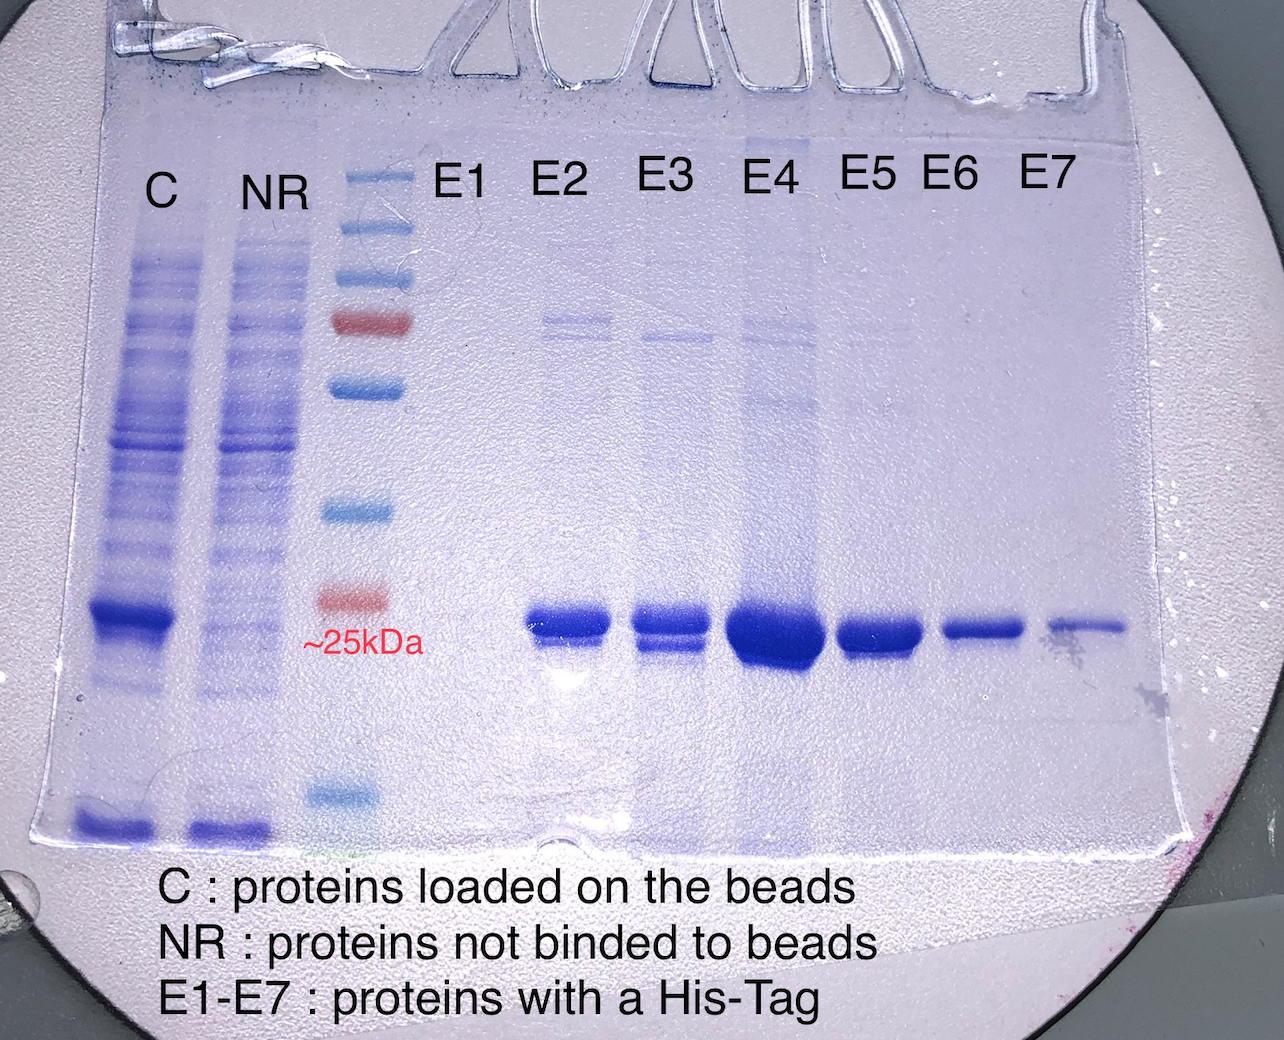 Figure 1: Different fractions of elution of AeBlueCP597
Figure 1 shows a gel of the various samples during the purification. The fractions E5 and E6 were pooled and used for further analysis. On the basis of Coomassie blue staining, we estimate our protein to be more than 98% pure.
Extinction coefficient identification
The extinction coefficient is calculated using Beer-Lambert’s law: A=ε*c*l.
A is the absorption, ε is the extinction coefficient, c is the protein's concentration and l is the optical path length. To estimate the experimental extinction coefficient we need to measure A, c and l.
Protocol
To measure the absorption spectrum, we diluted samples of our purified protein using the elution buffer B (50mM Tris-HCl (pH=8), 1M NaCl) in a 1cm path length analytical cuvette of the measurement container. Measurements were carried out on a Cary 3500 UV-Vis spectrophotometer at 25°C. An example spectrum is shown in figure 2.
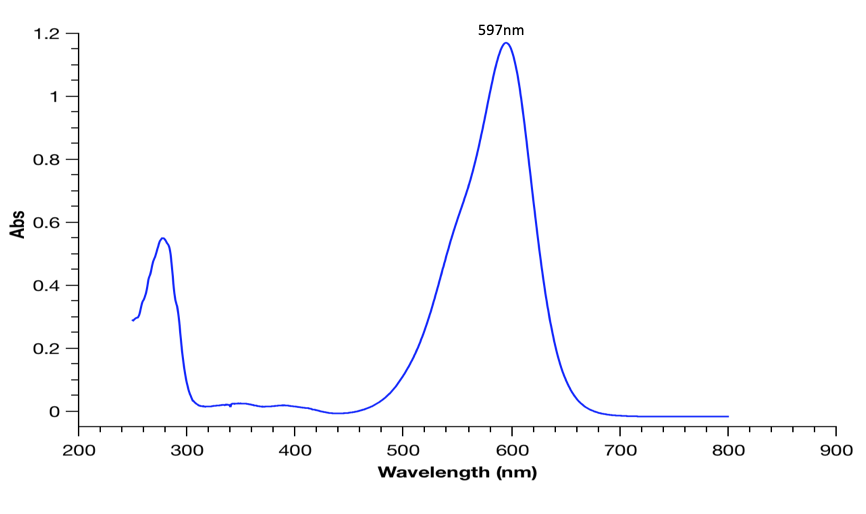 Figure 2 : AeBlue chromoprotein’s absorbance spectra
To measure the protein concentration, we used a Bradford protein assay with BSA as the standard. However, since our protein absorbs at 595nm, rather than measuring the Bradford reagent’s absorption at 595nm we measured it at 700nm. At his wavelength, aeCP597ce does not absorb. The calibration curve is shown in figure 3.
To determine our protein concentration, multiple dilutions and replicates were measured using the same protocol. We found a protein concentration of 11.4 +/- 0,625 µM (+/- 5,48% of error) for our sample.
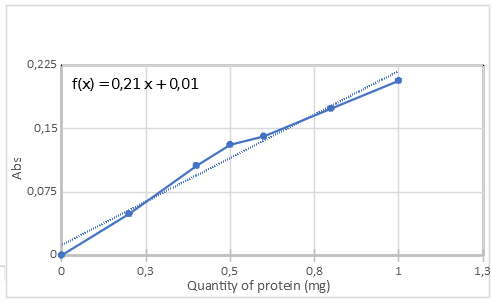
Figure 3: Calibration curve of the measurement
Results and discussions
Combining these values gives an extinction coefficient at the absorption maximum of 597 nm of 107 000 +/- 5 800 M-1 cm-1. We can compare our results with the extinction coefficient published in 2013 by Jan Laufer et al of 11 0000 M-1 cm-1. Thus, our results are in excellent agreement with the published value, though reading the article it is not entirely clear how this value was obtained. The largest source of error is probably the determination of the protein concentration using BSA as the standard. Different measurement methods (A280, BCA, Bradford) with different standard proteins (BSA, lysozyme etc.) can give different results with quite large variations (+/- 20 %).
Thermal stability examination
We wanted to study the thermosensibility of the chromoprotein as our test involves various high temperature incubations. We wished to know how resistant the proteins are to thermal denaturation.
Protocol
We used a solution of aeCP597 (absorption maximum ~ 1.0) in buffer B (50 mM Tris-HCl (pH=8), 1 M NaCl). To avoid the loss of evaporation, and thus a change of concentration, during heating a capped quartz cuvette was used. Measurements were made with an Cary spectrophotometer equiped with a Peltier temperature controller. Spectra were taken every 5°C between 25°C and 95°C. Once the sample reached the desired temperature, the cuvette was mixed (to avoid losing sample due to precipitation) and a spectrum measured.
Results
In figure 4 we show the spectra obtained at different temperatures between 250 nm and 800 nm.
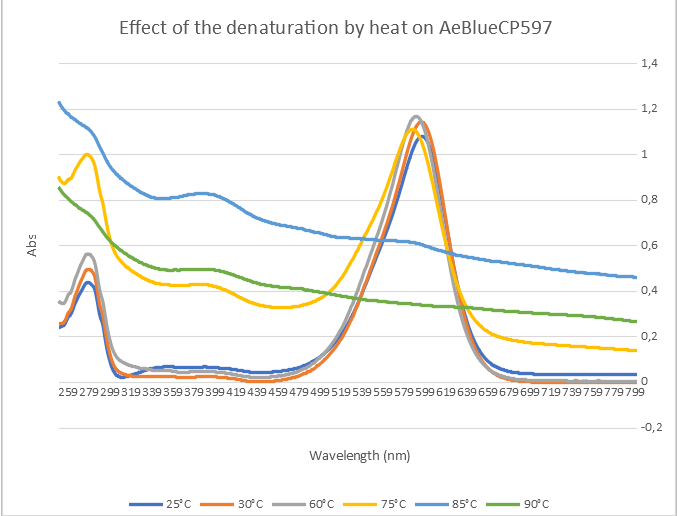
Figure 4 : Graph of the different spectra at different temperatures
The first thing to notice is a small shift in the absorption maximum from 597 nm to 595 nm between 25°C and 30°C. This is followed, at higher temperatures, by a loss of the absorption peak and a progressive increase in scattering as the protein is denatured. To obtain a more visual representation of the denaturation, we calculated the second derivative of the absorbance at 595 nm as a function of temperature. This is shown in figure 5. The graph clearly shows that the protein is stable at up to 60°C and then denatures and aggregates progressively.
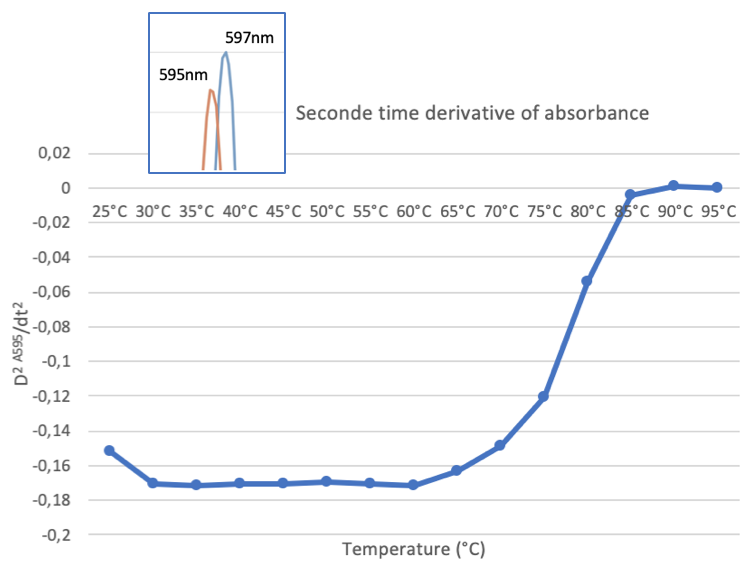
Figure 5 : Heat effect on AeBlueCP597
References
Jan Laufer, Amit Jathoul, Martin Pule, and Paul Beard, "In vitro characterization of genetically expressed absorbing proteins using photoacoustic spectroscopy," Biomed. Opt. Express 4, 2477-2490 (2013)