
Introduction
Escherichia coli Nissle 1917 (EcN) is probably the most intensively investigated bacterial strain today [1]. Despite the fact that the EcN strain is widely used as a probiotic, a lot of questions remain. Hence, we decided to dive deep into the characterization of EcN. Our goal was to find out more about EcN itself and to provide crucial information to include EcN as a platform organism for other iGEM Teams and researchers.
Growth Curves
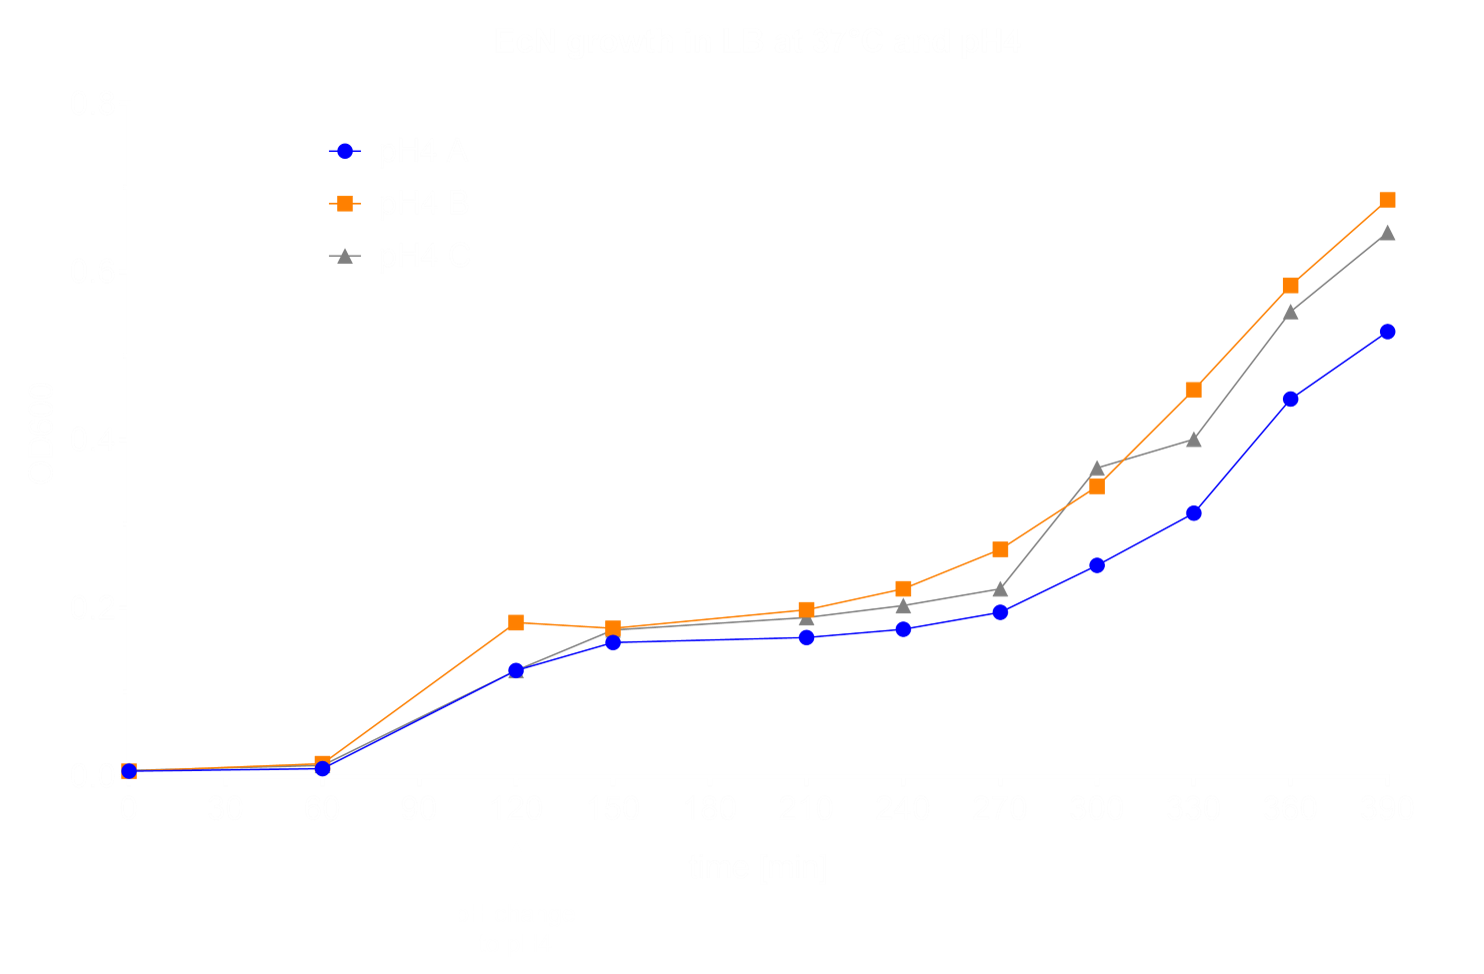
The first step in the characterization of a bacterium is conducting growth experiments in different media and under different conditions. This helps to get a better understanding of beneficial conditions for growth of the culture, which will improve folliwing experiments. We chose to perform half of our experiments under aerobic and the other half under anaerobic conditions. As a control, we grew EcN in LB medium at 37°C and pH 7 under aerobic conditions. We tested growth at a variety of different temperatures (25°C, 8°C, 4°C and 0°C) showing that EcN growth is inhibited at 8°C, the temperature often used for cold shock (Fig. 1).

Moreover, we evaluated the growth in the pH range from pH 6 to pH 1, since in our application EcN will have to pass the acidity of the stomach. Here, at pH 4 we discovered an interesting recovery of EcN growth after three hours (Fig. 2).

To look into inflammatory stress, we subjected EcN to up to 100 µM hydrogen peroxide [2] and showed that the growth is not substantially influenced by this chemical (Fig. 4).

Lastly, we performed dryfreezing and recovered EcN afterwards under control conditions [3][4][5]. The experiment showed that dryfreezing within skim milk protects the bacteria from substantial death (Fig. 5).

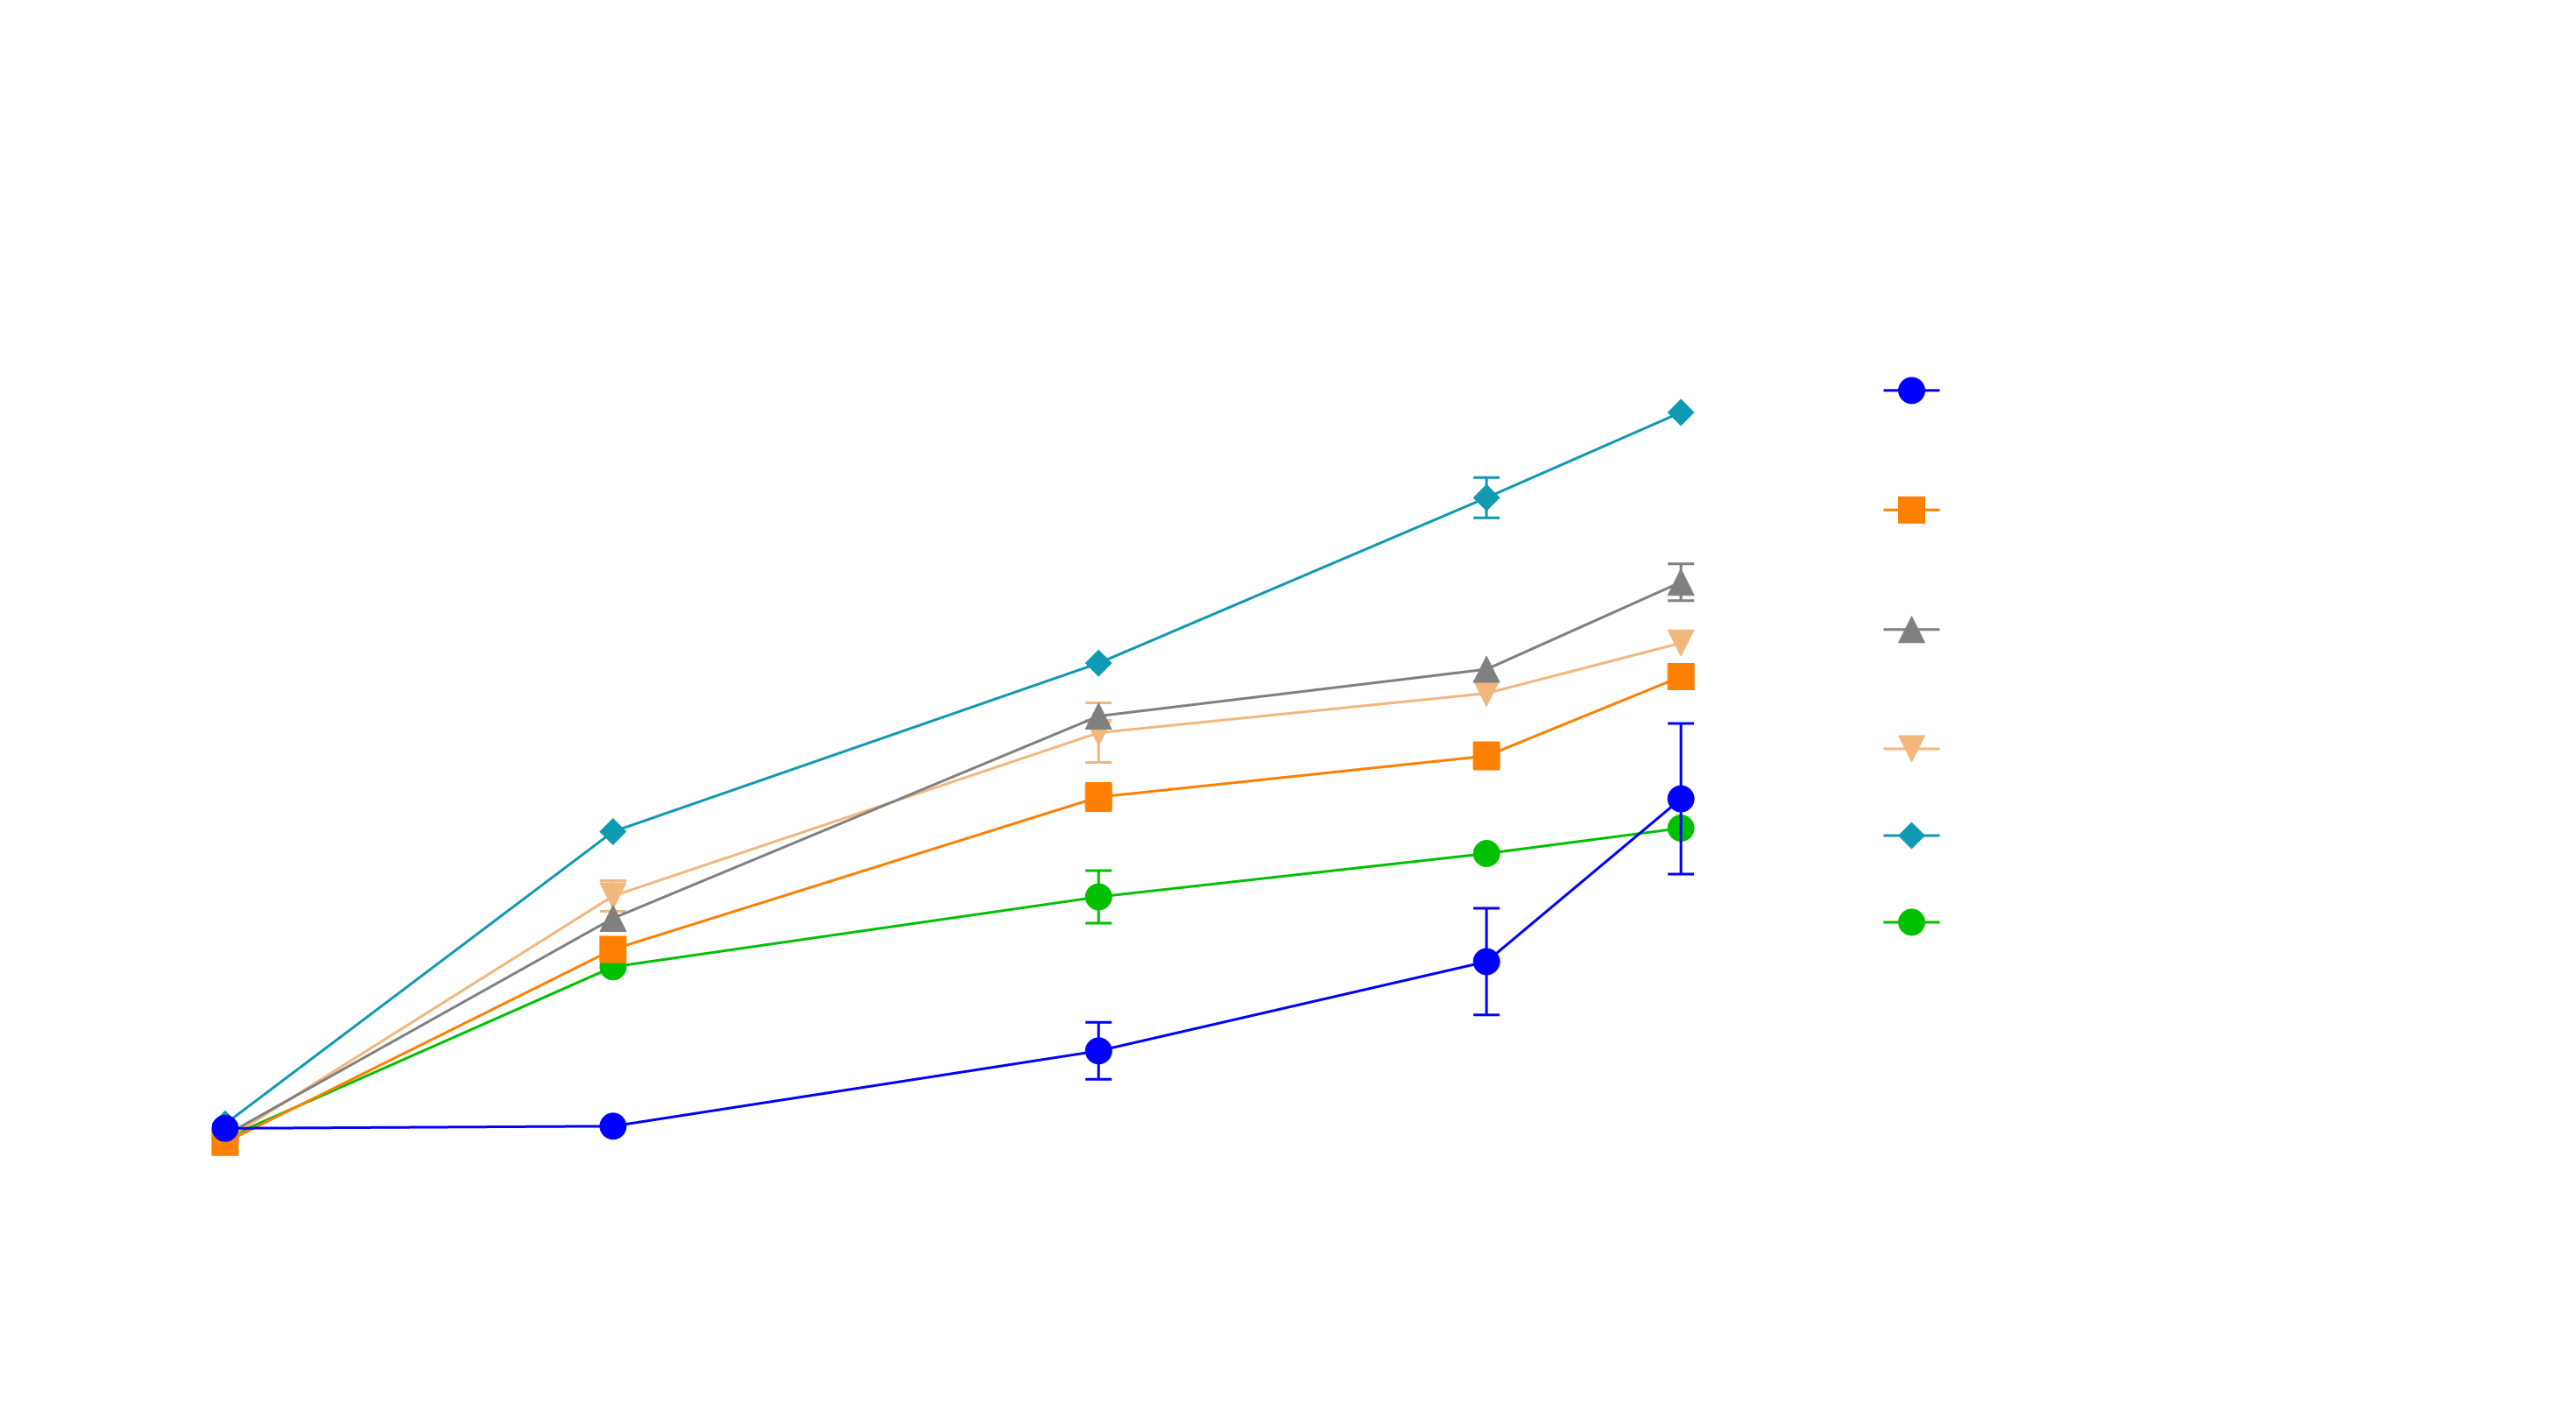
Anaerobic conditions were used to characterize EcN growth under the circumstances provided in the human intestines. Thus, as a control we compared EcN growth in LB medium versus mGAM medium under anaerobic conditions. The experiment showed that mGAM, a medium designed for anaerobic application, is in fact a more suitable medium (Fig. 6). Then, we subjected the culture to metformin treatment, since it is one of the most common treatments of Diabetes and is known to accumulate to 720 µM to 7.2 mM within the intestines due to low bioavailability [6][7]. We showed that EcN growth is not substantially influenced by 1.3 mM of metformin into mGAM medium (Fig. 6). Moreover, we tested for EcN’s resistance against cholic acid, since it is commonly secreted into the ileum. Here, we added 0.25 mM cholic acid to mGAM medium, considering that the concentration of free bile salts may rise to 0.25 mM to 1 mM of total bile salts in the Ileum, with cholic acid only being one component [8][9]. Our results suggested that EcN growth is not greatly influenced by cholic acid (Fig. 6).

Finally, we tested EcN interaction with other bacteria by adding bacterial supernatant to our medium. The supernatant was sterilized and provided by Dr. Lisa Maier. We chose Bacteroides thetaiotaomicron, Prevotella copri and Ruminococcus gnavus since they are commonly found within the human microbiome [10]. Bifidobacterium adolescentis was chosen due to its probiotic nature and Clostridium difficile supernatant was used, since it is often found in the microbiome of people with chronic inflammation [10][11]. The results suggest that EcN grows under all additions, however was initially inhibited in its growth by the addition of Bacteroides spp., thus we used these samples for RNA-Seq (Fig. 7).
RNA-Seq
The transcriptome describes the set of all RNA molecules in a population of cells and is subject to continuous changes. Understanding the complete transcriptome, the expressed genes, post-transcriptional modifications and additional properties of interest is imperative towards understanding genetic cause, disease and possible treatment strategies.
The inherent complexity of the transcriptome requires precise and scaling analysis techniques. RNA sequencing (RNA-Seq), also known as whole transcriptome shotgun sequencing (WTSS), is most commonly used for this purpose, today. It uses next-generation sequencing (NGS) to detect and quantify RNA in biological samples.
The generated RNA-Seq read data is then analyzed according to a sample RNA-Seq work-flow (Fig. 8).
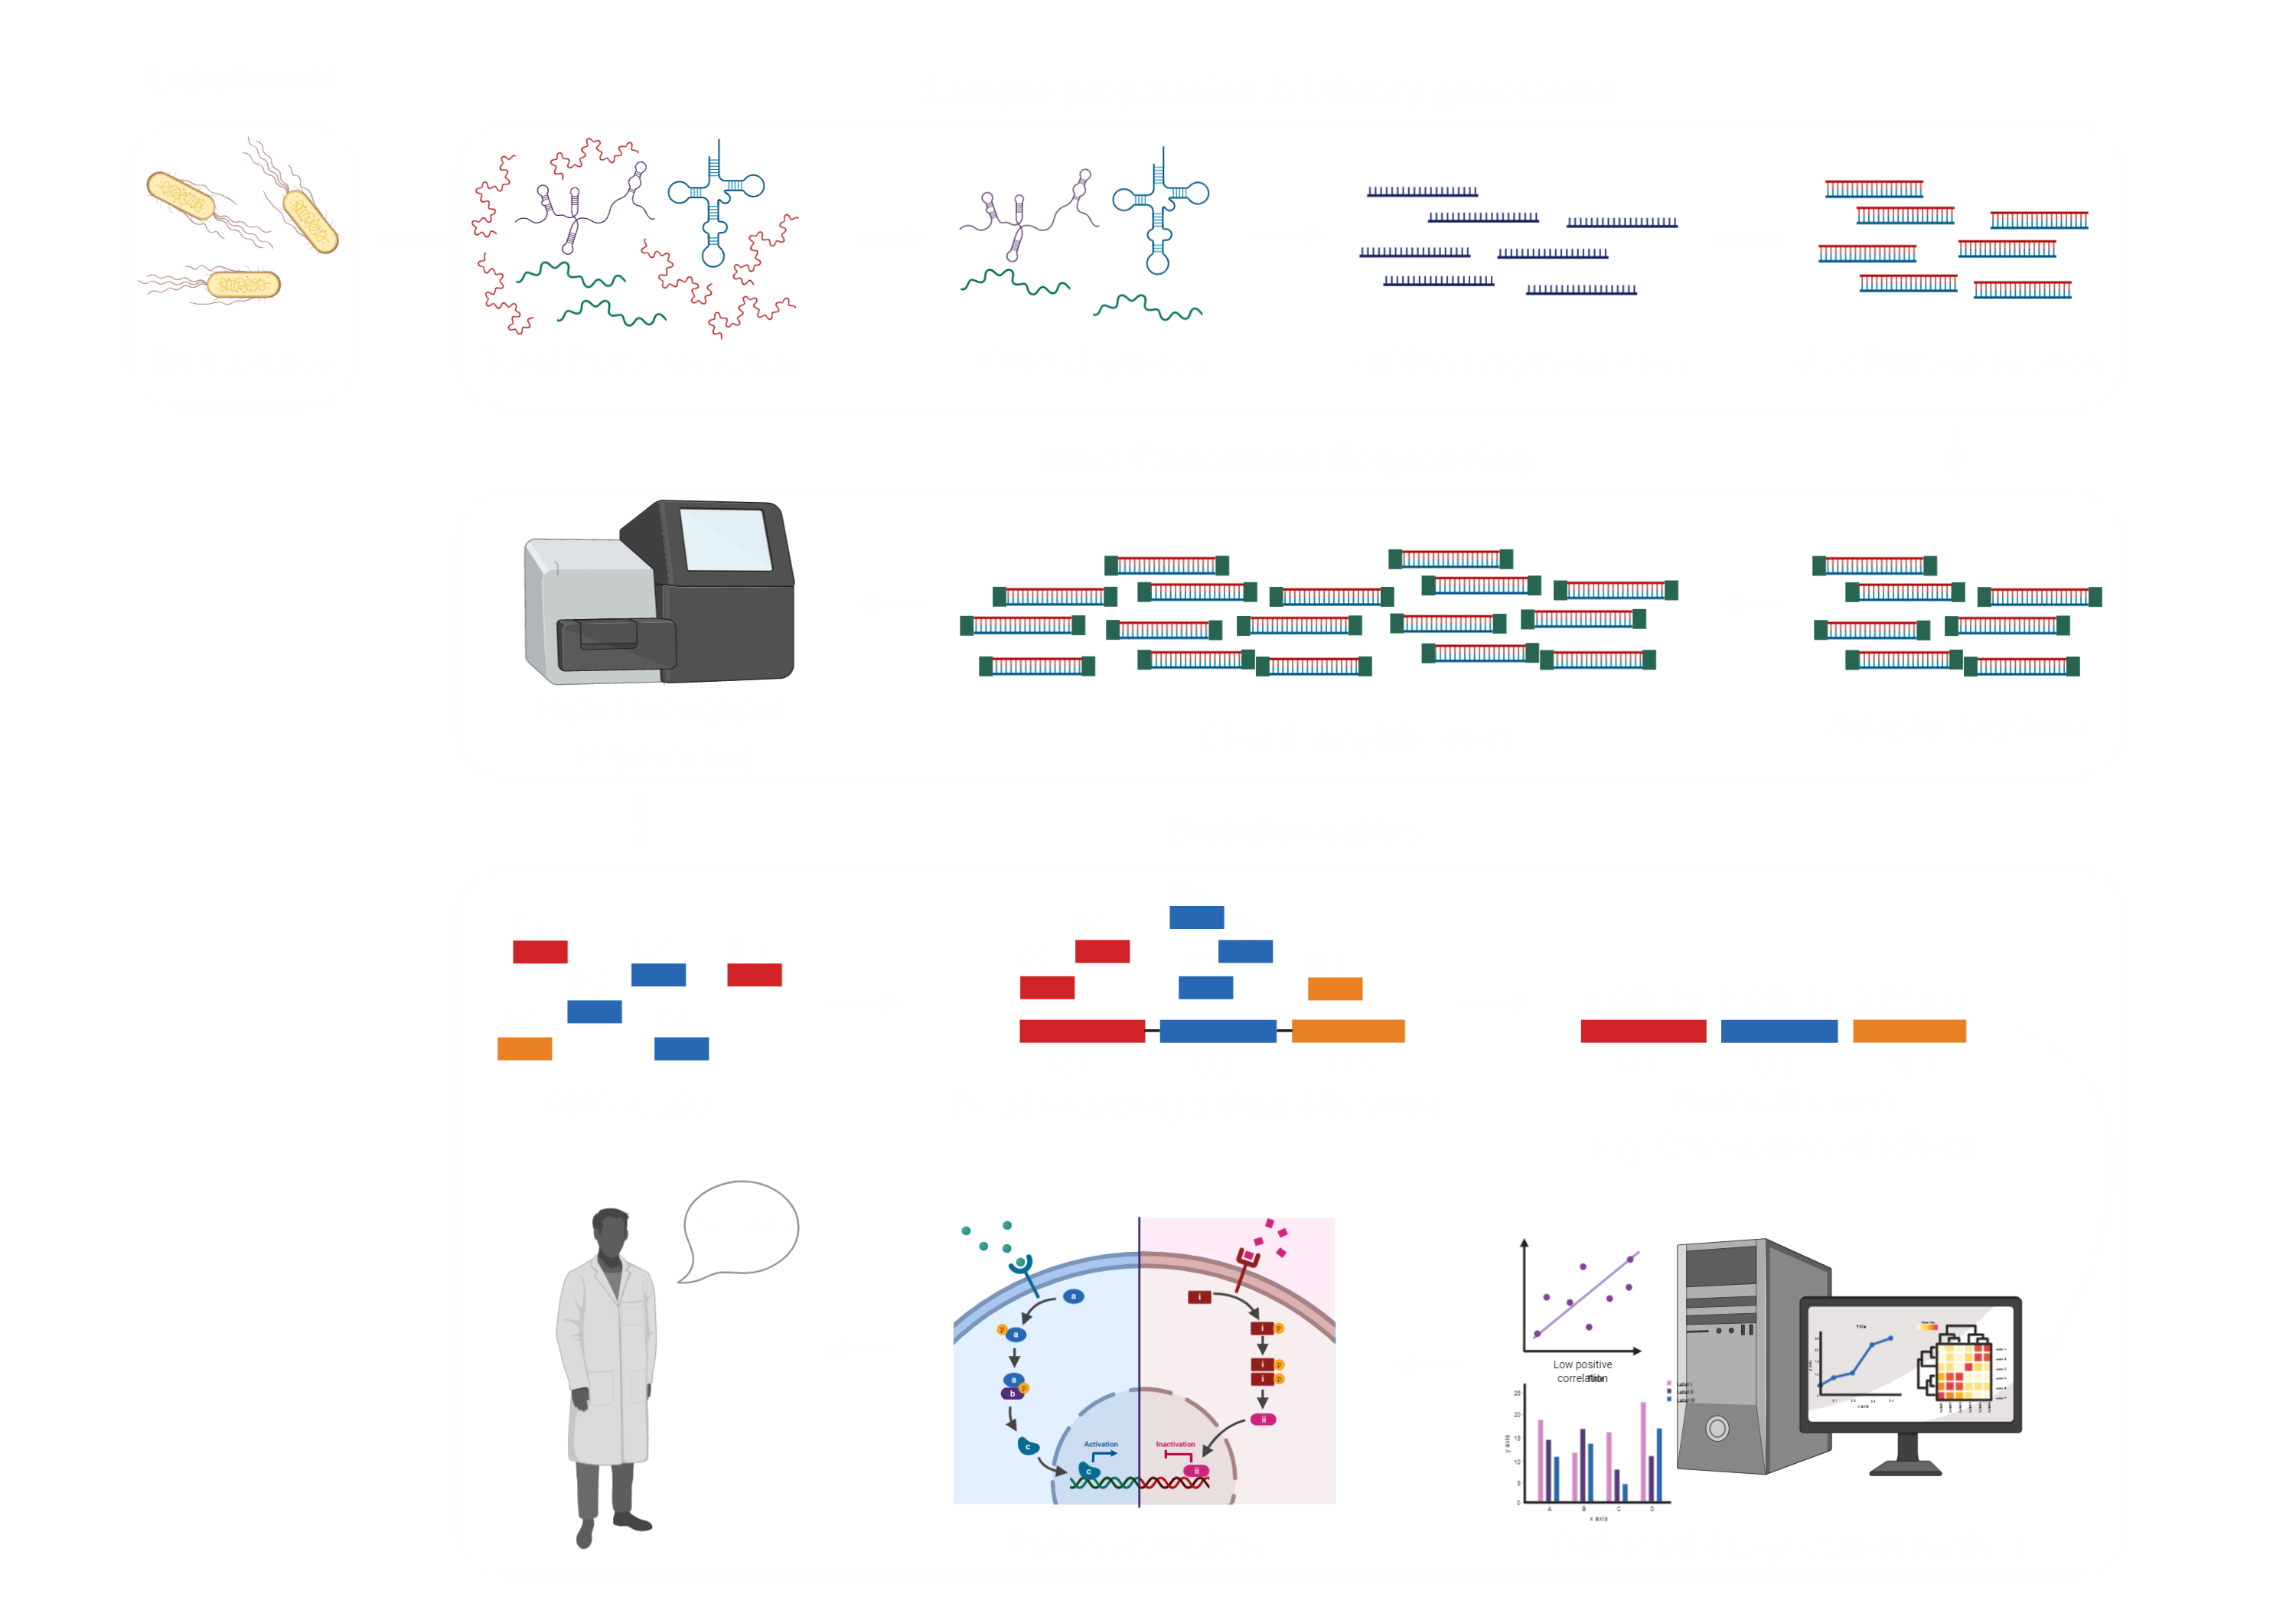
Next, a statistical analysis yields all differentially expressed genes, which are used for Gene Ontology (GO) enrichment, as well as pathway analysis.
We set ourselves the goal of understanding the transcriptomic changes thatE. coli Nissle 1917 undergoes under various stress conditions to gain a deeper insight into its responses. Understanding these stress responses of E. coli Nissle 1917 could lead to the development of more robust strains, which not only our project would benefit from, but also scientists working on probiotic drugs in general.
We divided our experimental design into two parts. One part was to investigate the effect of environmental stress on E. coli Nissle 1917 under aerobic conditions, the other part was to examine the responses under anaerobic conditions. Hence, our experimental design looks as follows:
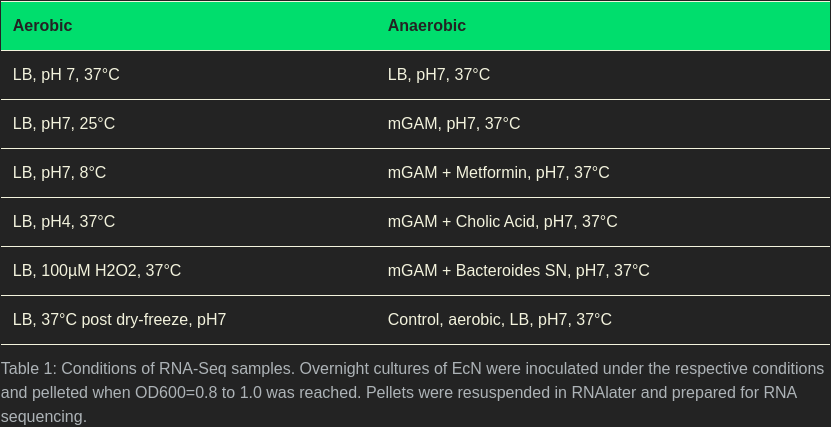
The respective temperature, pH values, and doses were determined by growth curves (Figures 1-6). To get the most out of RNA-Seq applied to stress factors, it is important to find the cutoff values, where E. coli Nissle 1917 is put under stress the most, but still survives.
Sequencing and library preparation was conducted on two sites. All aerobic samples were prepared and sequenced at the NGS Competence Center Tübingen (NCCT), whereas all anaerobic samples were prepared and sequenced at the European Molecular Biology Laboratory (EMBL) in Heidelberg. For more details please visit our Notebook and Outlook.
The following data analysis was, therefore solely conducted on the EMBL dataset.
Data Analysis
Since we received our sequencing data from the NCCT on the 18.10.2019, we weren’t able to analyze the data according to our standards in this short time frame. However, as noted in our Attributions, we will analyze both datasets in depth and are planning to publish the results next year
Workflow
Our complex and cutting-edge data analysis is based on several workflows and tools. The initial quality control and feature counting was conducted using the highly sophisticated nf-core/rnaseq pipeline. The pipeline is implemented in nextflow and runs singularity containers to absolutely ensure reproducibility. The workflow processes raw data from FastQ inputs (FastQC, Trim Galore!), aligns the reads (STAR), generates counts relative to genes (featureCounts) or transcripts (Salmon, tximport), and performs extensive quality-control on the results (RSeQC, Qualimap, dupRadar, PreseqPreseq, edgeR, MultiQC).
The differential gene expression analysis was conducted using qbic/rnadeseq, a nextflow based pipeline, which was also run with a singularity container for reproducibilities sake. The workflow runs DESeq2 for the detection of differentially expressed genes. The pathway analysis was conducted manually using clusterprofiler.
Quality Control
The following is only a small selection of all quality control metrics. A focus is set on the most interesting and important quality control metrics. We highly recommend visiting our downloads page to download the full interactive multiqc report. It features short explanations of the quality metrics and lots of useful plots.

The quality of the reads at every position has a Phred score of at least 32, demonstrating that the sequencing quality is very high (Figure 9). Moreover, the usually observed decline in quality at the end of the reads due to phasing is exceptionally small.

Duplicated reads were assessed using DupRadar. DupRadar provides duplication rate quality control for RNA-Seq datasets. Highly expressed genes can be expected to have a lot of duplicate reads, but high numbers of duplicates at low read counts can indicate low library complexity with technical duplication. Our distribution follows the expected trends. Hence, we can rule out excessive rRNA contamination or excessive PCR artifacts.
To verify that our replicates are indeed replicates of the same condition, and also to explore whether or not our various conditions indeed have a biological effect and differ from the anaerobic ground truth, we created a Multidimensional scaling (MDS) plot using edgeR. MDS visualizes the level of similarity of individual cases of a dataset.
It is used to translate "information about the pairwise 'distances' among a set of n objects or individuals" into a configuration of n points mapped into an abstract Cartesian space. MDS is a form of non-linear dimensionality reduction.


It can be observed, that the majority of the reads are protein coding, with some mapping to sRNA and rRNA. Sample four shows significant rRNA contamination, but still in tolerable numbers.
All in all, our extensive quality control suggests that the libraries were well prepared and rRNA or adapter contamination is very low with anaerob sample four posing a small exception. However, since the quality was high enough according to our standards, it was still included in all downstream analyses. Our initial quality control already suggests, that biological differences between the samples are very likely to exist. These will be examined more in depth in the first step of our downstream analysis: Differential expression analysis.
Differential Expression Analysis
To evaluate the results of our RNA-Seq experiments, we performed a differential expression analysis using DESeq2. This allows identifying the genes which are differentially expressed between the anaerobe control and the respective treatment conditions. Looking at the list of differentially expressed genes allows first interpretations of the results and give a good starting point for more in-depth analysis.


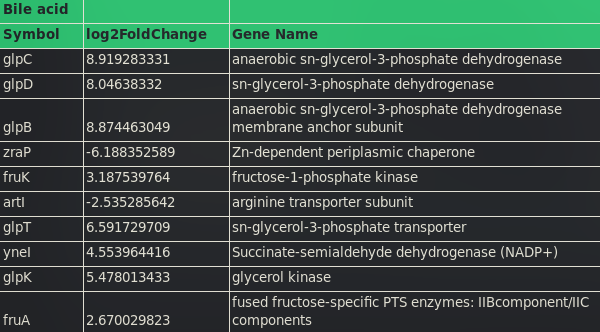


The conditions bile acid, metformin, bacterial supernatant, and mGAM all share common genes among the Top 10 differentially expressed genes. The anaerobic sn-glycerol-3-phosphate dehydrogenase is the most differentially expressed gene in all those conditions, with a log2Fold change greater than 8. Other prominent gens are the succinate-semialdehyde dehydrogenase (NADP+) which is highly upregulated in the mGAM, metformin and bile acid sample and the Zn-dependent periplasmic chaperone, which is downregulated in all samples except the supernatant treatment.
In general, the most differentially expressed gene set of the aerobe treatment against the anaerobe control is more dissimilar to the other conditions. A more in-depth functional analysis can be performed using GO term enrichment or pathway analysis.
Enrichment
To identify groups of genes that are overrepresented under treatment conditions, gene set enrichments for common gene ontology (GO) terms and pathways were performed. GO terms are standardized functions, processes or components defined by the GO initiative across all species, which facilitate functional interpretation of experimental data. The enrichment allows summarizing the large list of differentially expressed genes into a smaller list of affected biological processes that changed most on the treatment. We highly recommend to download our Parts / Downloads site to download far more plots of the enrichment analysis, than we can show on this page.
The GO enrichment funneled hundreds of differentially expressed genes into a few easily interpretable categories for the anaerobic and aerobic samples cultivated in LB medium, and bile acid and Metformin treated cultivated in mGAM medium under anaerobic conditions. Each sample was compared against an anaerobic cultivated control in the mGAM medium. The Metformin and bile acid-treated samples, both cultivated in mGAM medium, had the least number of differentially expressed genes. The aerobic and anaerobic sample grown in LB medium and the sample treated with bacterial supernatant had a much larger number of differentially expressed genes.
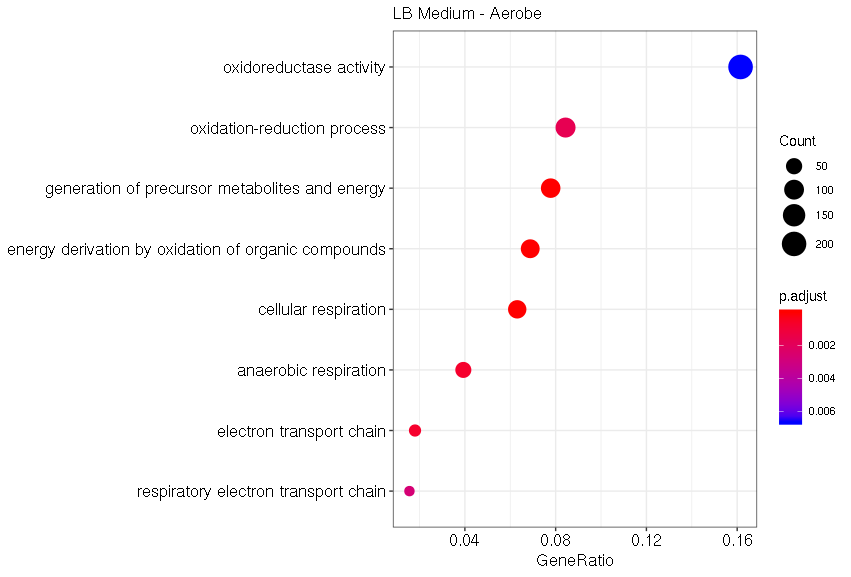
Under aerobic conditions with the typical LB medium, the most significant GO terms are related to cellular respiration and oxidation-reduction processes (Fig. 12). Those effects can be explained by the drastic condition changes compared to the anaerobic control grown under the mGAM medium. Those drastic changes in gene expression of E. coli Nissle 1917 highlight the difference between typical lab conditions, aerobic and LB medium, and the conditions in the human gut, which we tried to model with our control sample.
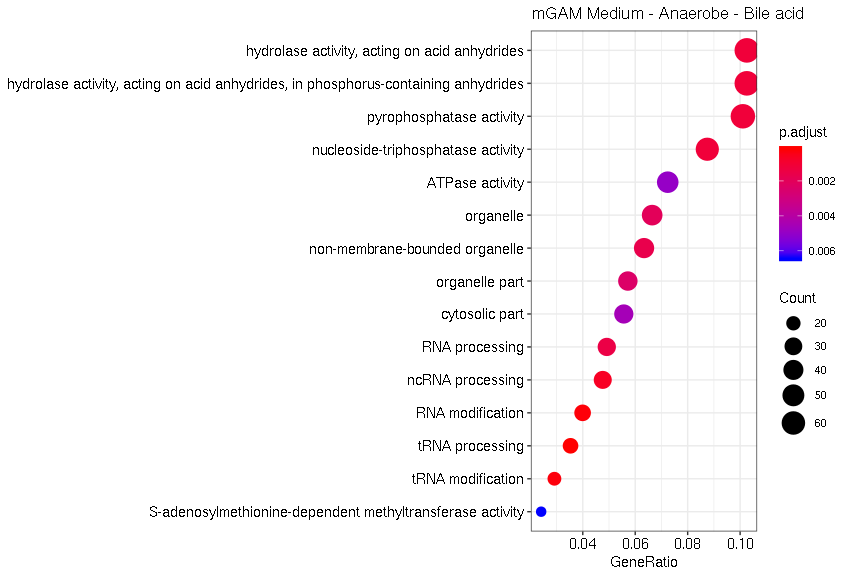
Bile acid treatment results in the enrichment of GO terms related to RNA processing (Fig. 13). In general, the effect of bile acid on the gut microbiome can be explained by the amphipathic nature of the molecule, which is largely involved in shaping the gut composition. Moreover, also processes related to hydrolase activity are directly affected by bile acid treatment of E. coli Nissle 1917.

Metformin treated samples show an upregulation of flagellum related genes (Fig. 14). Increased bacterial motility is a well-known response to various stress factors, meant to move away from the stress-inducing source.
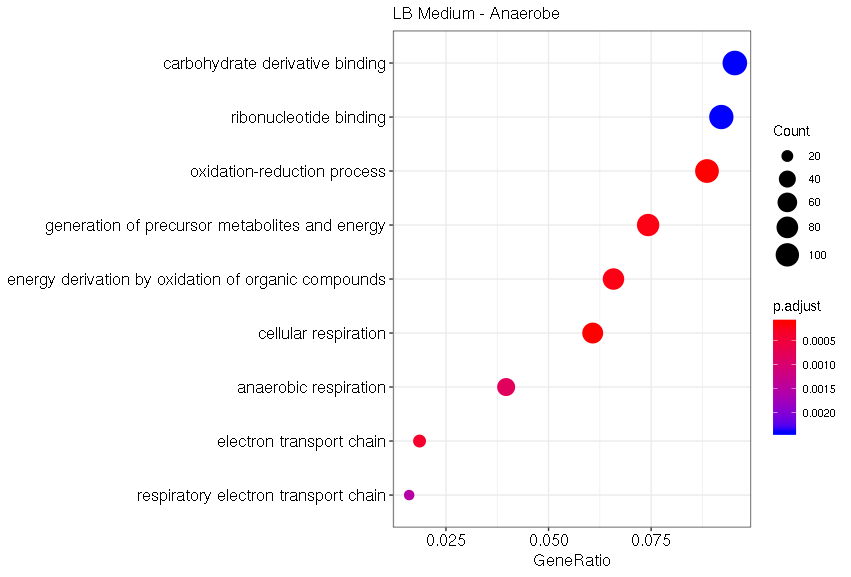
Cultivation of E. coli Nissle 1917 in LB medium under anaerobic conditions affect processes related to cellular respiration and metabolite uptake (Fig. 15). This can be explained by the differences in the culture medium (LB medium vs. mGAM medium), which both have different compositions. Therefore using the typical LB medium for the cultivation of E. coli Nissle 1917, the response and general behavior of the bacterium might differ from the reaction under the conditions in the human gut, which were modeled using the mGAM medium.

Using bacterial supernatant for the cultivation of E. coli Nissle 1917, to simulate the effects of cocultivation of different bacteria, results in the enrichment of gene groups related to ribosome and ribosome binding, which are significantly downregulated (Fig. 16). Therefore, all protein translations processes of the bacterium are affected.
Since our probiotic system largely relies on the detection of glucose, we investigated the changes in glucose metabolism of E. coli Nissle 1917. Cultivation under aerobic conditions resulted in the upregulation of many glycolysis or ATP-production related genes. The treatment with metformin, bile acid, the bacterial supernatant or anaerobic conditions in LB medium had only little effect on ATP biosynthesis-related genes (Fig. 17). For the four other conditions, besides the aerobic condition, some log2Fold changes can be observed in the cluster heatmap but weren't significant.

Summary
In general, a clear difference in expression profiles of samples cultivated under aerobic and anaerobic conditions can be observed. This result was expected since the availability of oxygen largely influences the whole metabolism of the bacterium. This is a crucial aspect that has to be considered when working with E. coli Nissle 1917 and in general all bacteria, which are meant to be used as probiotic. In particular, ATP-biosynthesis related genes were upregulated for the samples cultivated under aerobic conditions.
Generally, treatment with bile acid, metformin, the bacterial supernatant, and anaerobe cultivation with LB medium resulted in more similar expression profiles than compared to the aerobic samples (LB medium). Our results indicate a potential increase in bacterial motility caused by Metformin, a frequently used drug for Diabetes patients. Moreover, the supernatant of Bacteroides spp., a commonly found bacterium within the human microbiome, resulted in a downregulation of many ribosome-related genes, which indicates an interaction with E. coli Nissle 1917. However, further experiments are required to draw a conclusion.
Metabolic Model
Our E. coli Nissle 1917 characterization includes our metabolic modeling. Please visit our model subpage for more details.
References
- Ulrich Sonnenborn, Escherichia coli strain Nissle 1917—from bench to bedside and back: history of a special Escherichia coli strain with probiotic properties, FEMS Microbiology Letters, Volume 363, Issue 19, October 2016, fnw212,
- Sana Ben Othman and Tomio Yabe. Use of Hydrogen Peroxide and Peroxl Radicals to induce Oxidative Stress in Neuronal Cells. Reviews in Agricultural Science, 3:40-45, 2015. Doi: 10.7831/ras.3.40
- P. Capela, T.K.C. Hay, N.P. Shah. Effect of cryoprotectants, prebiotics and microencapsulation on survival of probiotic organisms in yoghurt and freeze-dried yoghurt. Food Research International. Volume 39, Issue 2, 2006, Pages 203-211, ISSN 0963-9969, https://doi.org/10.1016/j.foodres.2005.07.007.
- Govender M, Choonara YE, Kumar P, du Toit LC, van Vuuren S, Pillay V. A review of the advancements in probiotic delivery: Conventional vs. non-conventional formulations for intestinal flora supplementation. AAPS PharmSciTech. 2014;15(1):29–43. doi:10.1208/s12249-013-0027-1
- https://opsdiagnostics.com/applications/lyophilization/ecoli_lyophilization_stability.html
- Bailey, C. J, Wilcock, C, Scarpello, J. H. B. Metformin and the intestine. Diabetologia. 2008. Volume 51, Issue 8, Pages 1552, ISSN 1432-0428, Doi: 10.1007/s00125-008-1053-5,
- High Accumulation of Metformin in Colonic Tissue of Subjects With Diabetes or the Metabolic Syndrome. Paleari, LauraBurhenne, JürgenFoersch, SebastianParodi, AndreaGnant, MichaelScherer, DominiqueUlrich, Cornelia M.Stabuc, BorutPuntoni, MatteoCoccia, GianniPetrera, MarilenaHaefeli, Walter-EmilDeCensi, Andrea et al. Gastroenterology, Volume 154, Issue 5, 1543 - 1545
- Martinez-Augustin O, Sanchez de Medina F. Intestinal bile acid physiology and pathophysiology. World J Gastroenterol. 2008;14(37):5630–5640. doi:10.3748/wjg.14.5630
- Postprandial concentrations of free and conjugated bile acids down the length of the normal human small intestine. T. C. NORTHFIELD AND I. McCOLL. Gut, 1973, 14, 513-518
- Belizário JE, Napolitano M. Human microbiomes and their roles in dysbiosis, common diseases, and novel therapeutic approaches. Front Microbiol. 2015;6:1050. Published 2015 Oct 6. doi:10.3389/fmicb.2015.01050
- Lloyd-Price J, Abu-Ali G, Huttenhower C. The healthy human microbiome. Genome Med. 2016;8(1):51. Published 2016 Apr 27. doi:10.1186/s13073-016-0307-y

