Team:KUAS Korea/Characterization
Characterization
We have selected one of the parts registered so far in the RSBP and conducted characterization. This task increases the reliability of the RSBP itself by clarifying the characteristics of the existing part and removing the useless part. And it is a very important work as a basis for improving access to synthetic biology.
Transformation
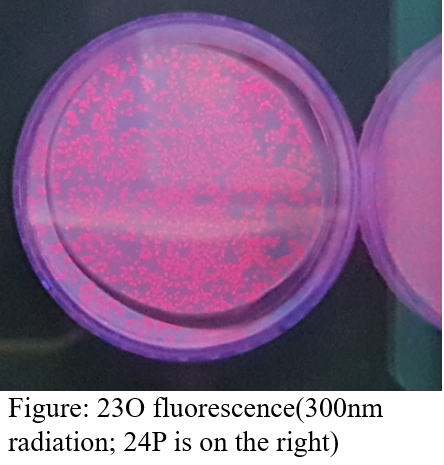
We decided to examine the activity of fluorescent protein in relation(‘light’) to our iGEM 2019. Verification of activity of fluorescent protein is much easier than identification of luminescent enzyme activity. And the conditions in the laboratory we use were good for checking the activity of the fluorescent protein. This is because we have purified fluorescent protein. For this reason, we searched the first plate of the distribution kit for parts that were encoding various fluorescent proteins and found 13 parts. The coordinates on the plates of each part are as follows; 9I, 9K, 9M, 11A, 13H, 13K, 14B, 18C, 19I, 23O, 23P, 24P. all the remaining parts are encoding RFP proteins except BBa_K592100(19I), a part that is encoding BFP. They were found in the plate and resuspended with 80μl of DW, and half of them were used for the transformation of the E. coli DH10B strain. A single colony is obtained by coating the converted E. coli on the LB-CHL medium. Since the parts of the distribution kit plate 1 are inserted in pSB1C3 vectors, which has a chloramphenicol resistant gene, we added chloramphenicol to the growth medium to select the transgenic strains.
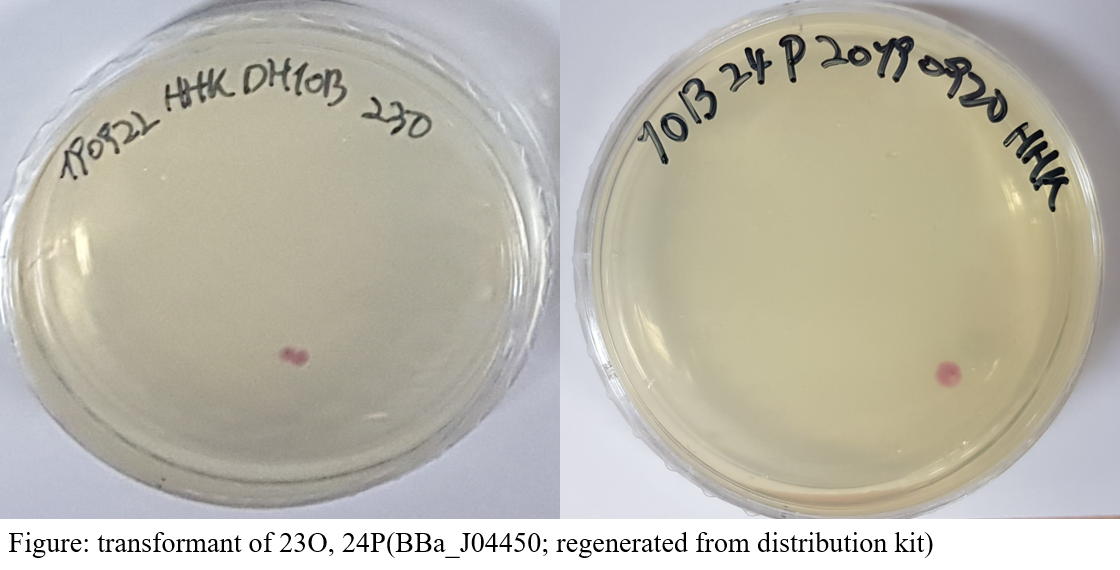
As a result, we selected 2 coordinates and determined to characterize them; 23O, 24P. In fact, the two parts are the same parts (BBa_J04450; will be called 23O, 24P), which encodes mRFP1 with lacI promoters, RBS and terminators, expressing mRFP without any manipulation. Information on parts registered in the RSBP was mostly about the growth rate of strains and the excitation/emission wavelengths of fluorescence. So, we decided to draw a standard curve based on purified mRFP1 and test the amount of protein per cell over a certain period.
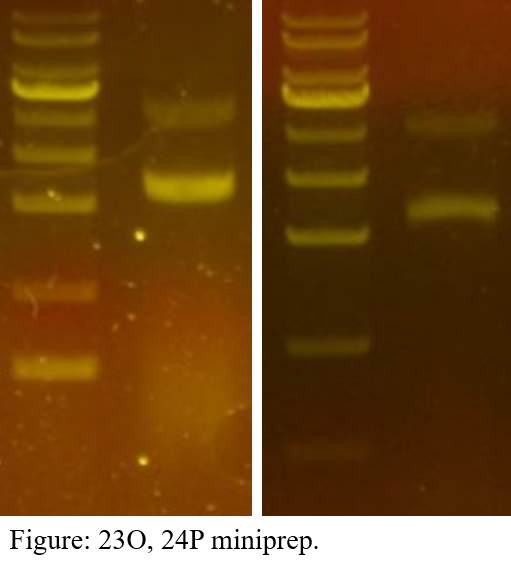
Minipreparation
First of all, the colonies were selected and cultured, and each plasmid was extracted.
Drawing standard curve for the absorbance of transformants
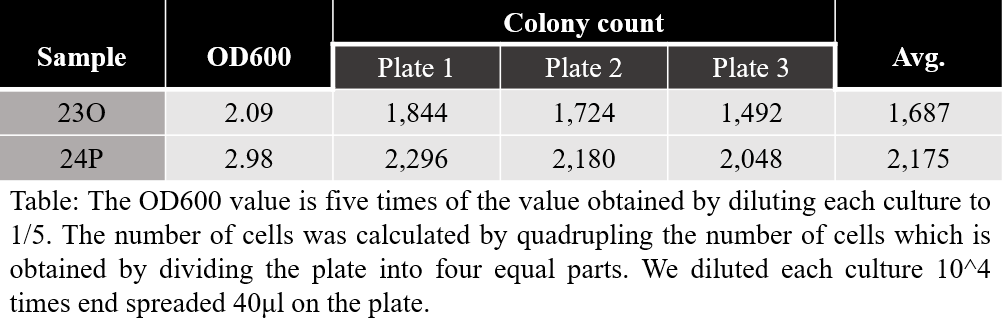
We needed to check how many cells were in the culture in order to know the rate of expressed protein per cell. The degree of suspension of the culture is measured by an optical density of a sample measured at a wavelength of 600nm(OD600) using a spectrophotometer. According to the Beer-Lambert law, the OD600 value and the degree of the suspension have a linear relationship, and in the culture, the standard curve for it can be drawn to calculate the number of cells per unit volume according to the OD600 value.
To measure this, we first made a sufficiently saturated liquid culture solution. The OD600 was then measured by diluting it to a ratio of 1:5. Dilutions are for the proper range of spectrophotometer. Then 1 ml of the original liquid medium was taken, and it was continuously diluted and spread to the LB-CHL medium. The next day, we counted the number of cells by assuming 1 colony is 1 cell. Considering dilution, this showed the number of DH10B cells expressing mRFP1 at BBa_J04450 at a specific OD600 value.
Result
Measurements of the number of cells for a given OD600 value in two samples 23O, 24P are given in the following table.
We derived a linear equation under the assumption that if there is no cell, then OD600 is zero. And we could see the number of cells per unit volume, which appears as a gradient of the slope. In the figure below, the blue line is the graph for 23O and the red line is the graph for 24P.
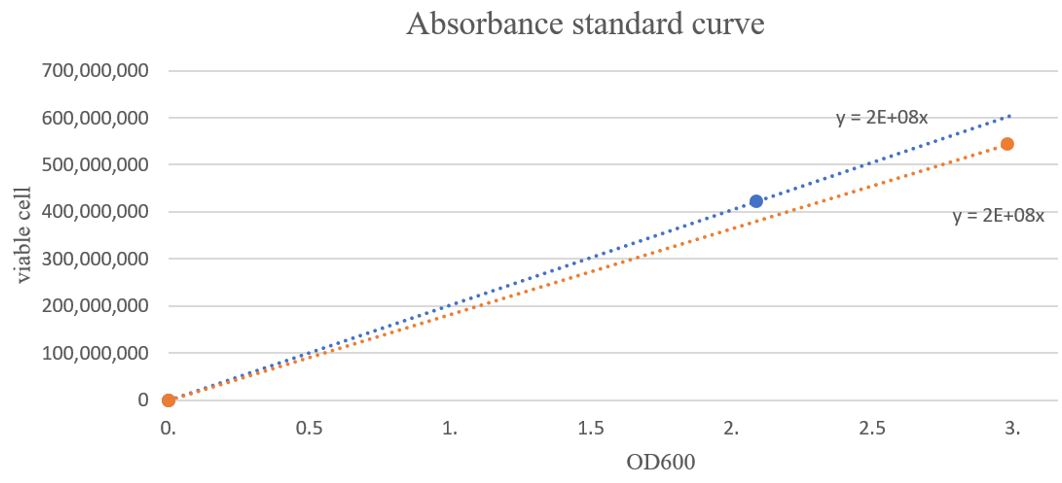
The average slope of 23O and 24P was found to be about 2E+8 viable cell/OD600·ml.
Drawing standard curve for the fluorescence of mRFP1
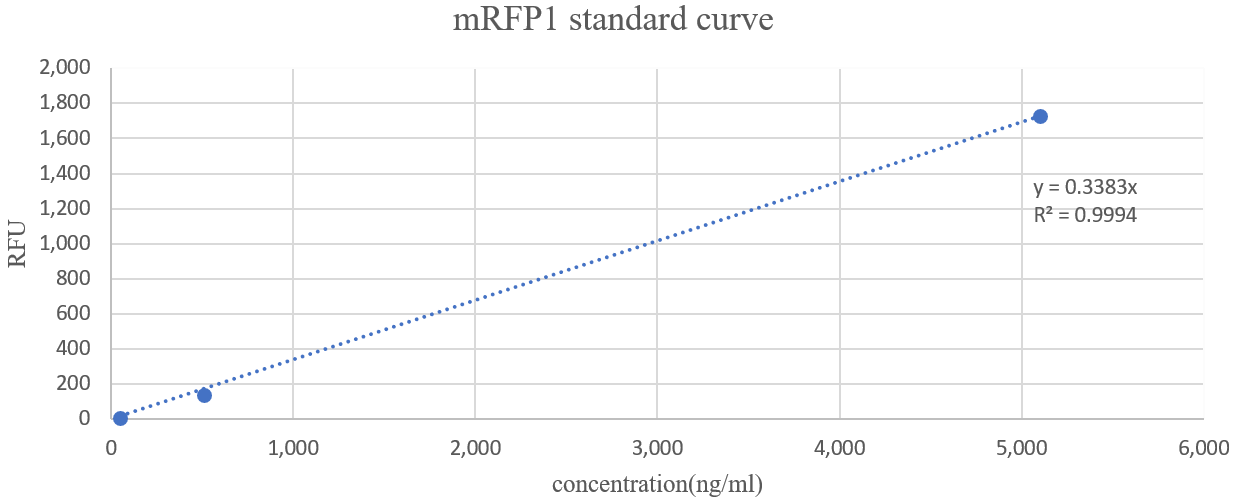
A standard curve is required to calculate the amount of expression through the measurement of fluorescence. This is because luminometer outputs only relative value(RFU; Relative Fluorescence Unit). So, we obtained the standard curve by measuring fluorescence using purified mRFP1. The original concentration of purified mRFP1 was known and each fluorescence was measured (530 nm/590 nm) by diluting it from 10E-2 to 10E-4
The fluorescence(RFU) measured on each sample shall be as follows.
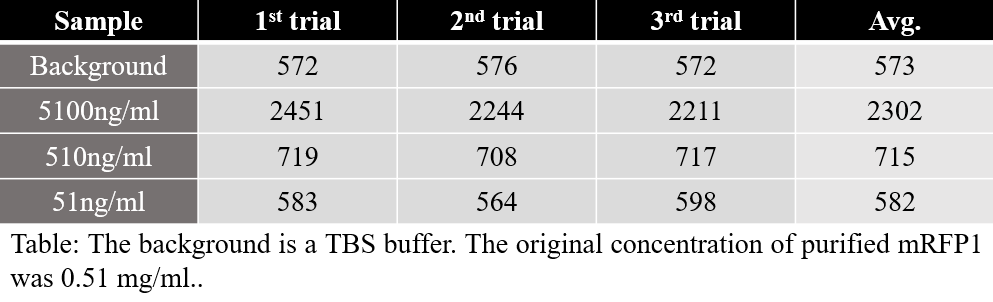
Background noise(measured by TBS buffer) was removed from this figure, corrected, and linearized. The results are as follows. The function was obtained by drawing a trend line under the assumption that when the concentration is zero, the fluorescence also should be zero.
Activity test
Now we can conduct an activity test to find the amount of expression using the two standard curves we have obtained. The 23O and 24P transformants were incubated for six hours each and stopped incubation. In the subsequent process, the culture was kept cold using ice to prevent E. coli from growing any longer. The OD600 value was measured by diluting the culture fluid to 1:5. Based on this value, each specimen was concentrated or diluted to make the OD600 value equal to 1. Finally, using a luminometer we measured the fluorescence of this solution. And we can calculate the amount of mRFP1 per cell using the specified values.
In this process, fluorescence was measured with an OD600 value of 0.615 due to incorrect dilution. However, having a standard curve, this was not an issue (we ignored background noise changes based on concentration shift).
The table for measured fluorescence is shown below. The large difference in RFU values in the two samples is due to different degrees of dilution. However, the calculated value of expression per cell were similar to each other.
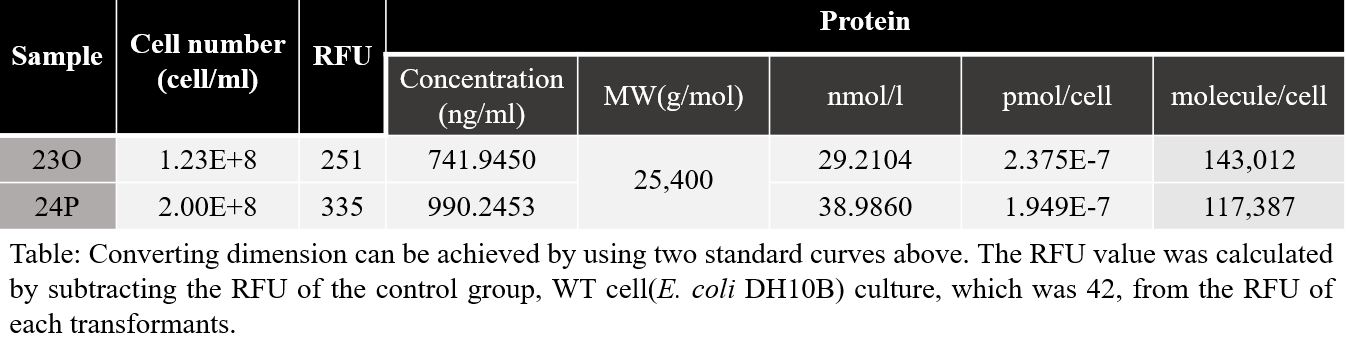
The amount of expression can be calculated using the molecular weight of mRFP1 being 25,400Da. Based on the calculated values from the two samples, we could assume that in the BBa_J04450 strain (E.coli DH10B) incubated for 6 hours, about 130,000 molecules of mRFP are present. It was quite impressive that all the measured values during characterization from the two samples(23O and 24P) known as the same part(BBa_J04450) were measured very similarly. Based on this characteristic data, the amount of expression per culture time should be investigated as well as 6 hours from now. Based on this, research can be furthered into find out the variety of cells per hour. Also, it would be better to check how the aspects vary in other strains.