Cesargrmzg (Talk | contribs) |
Cesargrmzg (Talk | contribs) (→Results) |
||
| Line 53: | Line 53: | ||
| 0.204 | | 0.204 | ||
|} | |} | ||
| + | |||
| + | We also add a code in the program to show the data in terms of mass and to be able to compare with established values, this in order to facilitate the determination of the inductor concentration | ||
| + | Output: | ||
| + | |||
| + | <center>''Final mass of:''</center> | ||
| + | <center>''Final mass of:''</center> | ||
| + | <center>''Final mass of:''</center> | ||
| + | <center>''Final mass of:''</center> | ||
| + | ligM: 16.4 fg | ||
| + | aroY: 14.0 fg | ||
| + | catA: 13.6 fg | ||
| + | |||
| + | Common E. Coli dry weight: 284 fg | ||
| + | Common total protein mass on E. Coli: 156 fg | ||
| + | Most expressed protein mass on common E. Coli: ~7.8 fg (MetE) | ||
<h3><span class="text-muted">Metabolic Pathway Model</span></h3><hr> | <h3><span class="text-muted">Metabolic Pathway Model</span></h3><hr> | ||
| + | |||
===Description=== | ===Description=== | ||
The model of the metabolic path was carried out in order to see the final impact of modifying pduU in the production and | The model of the metabolic path was carried out in order to see the final impact of modifying pduU in the production and | ||
Revision as of 01:11, 22 October 2019
Contents
PHYSICAL & MATH MODEL
Expression Model
Description:
Mathematical model was made with the objective of predicting the level of theoretical functionality of the designed system. We started the model trying to simulate the kinetics of the metabolic path, but we ran into the first problem, we did not know the concentrations of each enzyme or the concentration of vanillic acid, our first inducer, so it was decided that we had to first model the expression of our enzymes.
We need to make the expression model to know what is the most appropriate inductor concentration and know the enzyme concentrations that this would cause. This model can be separated in transcription and translation.
Transcription
Transcription is the phase in which mRNA is generated from DNA and can be expressed by the following equation:
In our case we use one of the promoters studied by Cristopher A. Voigt et al. [X] So the equation could be expressed as a function of the inductor as follows:
Translation
Translation is the phase in which proteins are produced from mRNA, this phase can also be expressed by an equation:
We have relied on the Howard M. Salis RBS calculator [X], where we have optimized our different RBS to have a force close to 10,000 AU, this means that we will have a high translation initiation rate. When the translation initiation rate assumes the translation bottleneck (which consists of the initiation, enlongation and termination phases), any increase in the initiation rate will be directly proportional to the translation rate so should be care that the initiation rate does not exceed the production capacity of the ribosomes.
Results
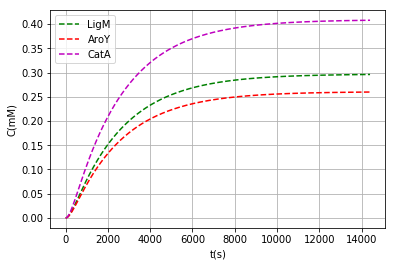
We found that the ideal inductor concentration not to radically interfere with cell metabolism is around 3μM and also had to choice an origin of replication with minimum number of copies (pbSB6C5) because of very strong RBS, all that leaves us with the following enzyme monomer concentrations after 4 hours of expression:
| Class | [Monomer] (mM) | [Enzyme] (mM) |
|---|---|---|
| ligM | 0.296 | 0.148 |
| aroY | 0.260 | 0.043 |
| catA | 0.408 | 0.204 |
We also add a code in the program to show the data in terms of mass and to be able to compare with established values, this in order to facilitate the determination of the inductor concentration Output:
ligM: 16.4 fg aroY: 14.0 fg catA: 13.6 fg
Common E. Coli dry weight: 284 fg Common total protein mass on E. Coli: 156 fg Most expressed protein mass on common E. Coli: ~7.8 fg (MetE)
Metabolic Pathway Model
Description
The model of the metabolic path was carried out in order to see the final impact of modifying pduU in the production and concentrations in cytoplasm (for toxicity reduction), for this, it was necessary to simulate with molecular dynamics the effect of this modification on porus permeability
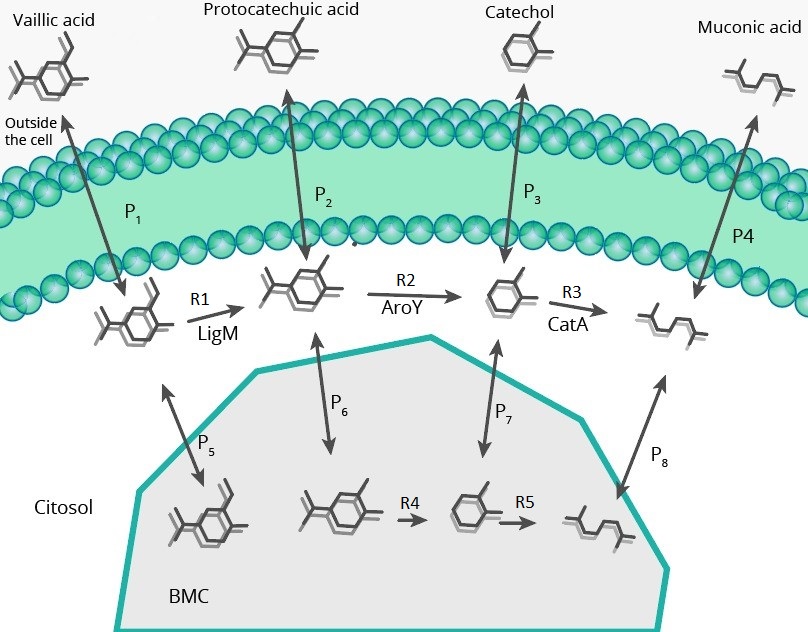
To model the metabolic path we have used two different proposals, in one of them the reaction catalyzed by ligM can occur within the BMC, while in the other (shown in the image above), this cannot happen because of a reagent (tetrahydrofolate), which is so large that it may not be able to enter the BMC. Enzyme concentrations in this model were taken from expression model
Equations
In the picture above we can see two different types of fluxes, the "RX" are enzymatic reactions, while the "PX" are permeability fluxes, these are described by the following equations:
Kinetics
We use the Michaelis-Menten kinetic equation due to the availability of the data, it is very easy to find the values of Km and Kcat unlike the kinetic constants of the law of mass action (which allow to make a more exact model).
Permeability
We decided to use an equation that would allow us to encompass all the variables that affect the permeability of a wall in a single constant (such as the diffusion of the reagents, permeable area, pore and reagent size, etc.), and ensure that the permeability is in concentration gradient function.
Results
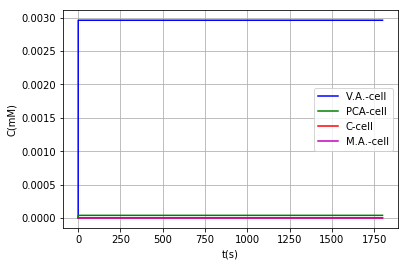
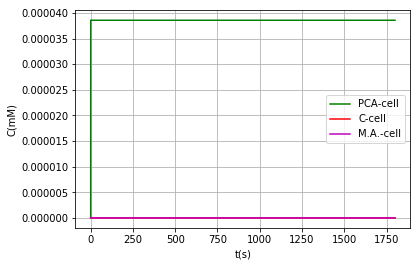
Either by using the model where vanillic acid can react within the BMC, or using the model in which it cannot, the conclusion that is obtained on the metabolic pathway is the same: It is a very inefficient route due to the low activity of AroY, as shown above, however in models where vanillic acid does not react inside the BMC we can find a favorable behavior when modifying the PduU pore:
| Substance | Concentration in cell (pduU) (μM) | Concentration in cell (pduU modified) (μM) | Effect: |
|---|---|---|---|
| Vanilic acid | 2.96 | 2.96 | - |
| PCA | 3.86e-2 | 3.86e-2 | - |
| Catechol | 1.42e-9 | 1.35e-9 | 5% reduction = Toxicity reduction |
| Muconic acid | 1.43e-9 | 1.50e-9 | 5% increased production |
Links
Hacer hipervinculo a github y pdf


