
Model Simulation
P2 genetic switch
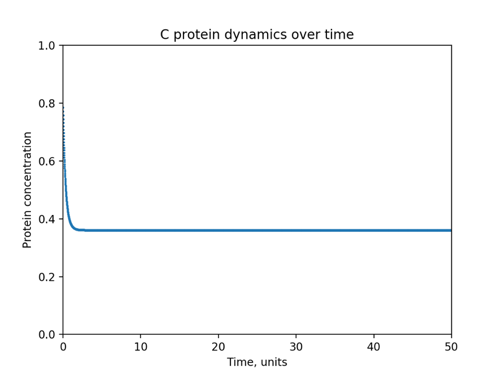
We first simulated C protein concentration dynamics in P2 genetic switch system over time using the final derived deterministic model:
$$\frac{dx}{dt\prime}=\frac{1+\tau u x^2}{1+ux^2+\sigma u^2x^4}-\gamma x=f(x)$$
We selected a time step of dt=0.01, as well as arbitrary parameters σ=2, u=1, γ=3, τ=2 and initial concentration of x=0.8. The following time series graph shows the stabilization of the protein concentration to a steady state.
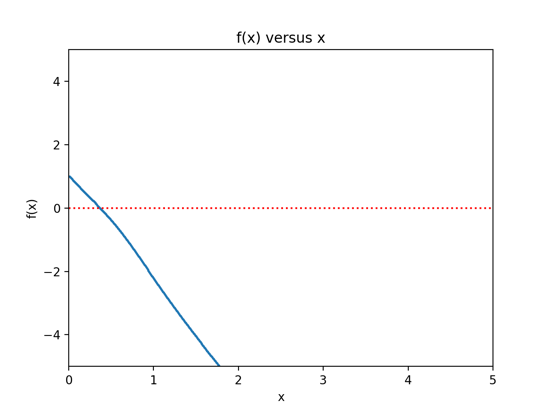
In order to determine the steady state concentration, we examine the f(x) versus x graph, from which we can tell the point where the graph crosses horizontal axis, corresponding to dx/dt=0, i.e. the steady state concentration. We determine this concentration being ~ 0.371.
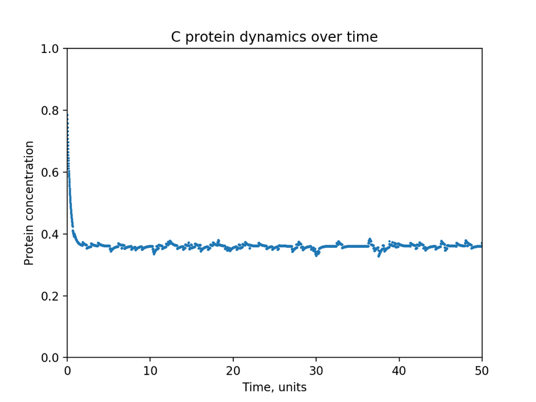
Simulating the model adapted to a stochastic setting results in a similar graph, which, however, includes more fluctuations due to random noise, introduced into the model.
To our knowledge, this is the first attempt to derive and simulate a model for P2 bacteriophage genetic switch.
Model Plasmid
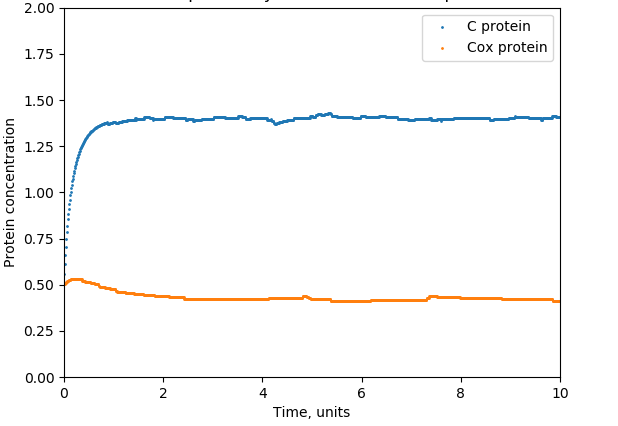
We first simulated C and Cox protein concentration dynamics in Model Plasmid system over time using the final derived deterministic model:
$$\frac{dx}{dt}=\frac{K_{t1}K_1[arabinose]}{1+arabinose}-αx$$
$$\frac{dm}{dt}=\frac{arabinose}{1+arabinose}-βm$$
We selected a time step of dt=0.01, as well as arbitrary parameters σ=2, u=1, γ=3, τ=2 and initial concentration of x=0.5. The following time series graph shows the stabilization of all C and Cox protein concentrations to a steady state.
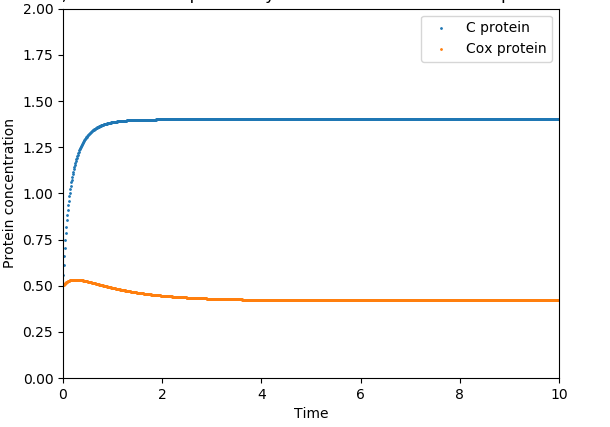
It depicts that C protein increases exponentially up to a certain concentration (x=1.75) and stabilizes after a certain time point, in this case t= 1 unit. Cox protein seem to be almost stabilised throughout by t=2 .
In order to determine the steady state concentration, we examine the f(x) versus x [dx/dt v/s protein concentration] graph, from which we can tell the point where the graph crosses horizontal axis, corresponding to dx/dt=0, i.e. the steady state concentration.

We determine this concentration for C protein= 1.1 and Cox protein = 0.9
Simulating the model adapted to a stochastic setting results in a similar graph, which, however, includes more fluctuations due to random noise, introduced into the model.
Switch Plasmid
We first simulated C, Cox and TetR protein concentration dynamics in Switch Plasmid system over time using the final derived deterministic model:
$$\frac{dx}{dt}=\frac{k_{t1}+k_{t3}K_1K_Dr^2}{1+K_3[arabinose]+K_1K_Dr^2+K_D^2K_1K_2r^4}-αx$$
$$\frac{dm}{dt}=\frac{k_{t2}K_3[arabinose]}{1+K_3[arabinose]+K_1K_Dr^2+K_D^2K_1K_2r^4}-βx$$
$$\frac{dr}{dt}=\frac{k_{t2}K_3[arabinose]}{1+K_3[arabinose]+K_1K_Dr^2+K_D^2K_1K_2r^4}-γx$$
We selected a time step of dt=0.01, as well as arbitrary parameters σ=2, u=1, γ=3, τ=2 and initial concentration of x=0.5. The following time series graph shows the stabilization of all the three protein concentrations to a steady state.
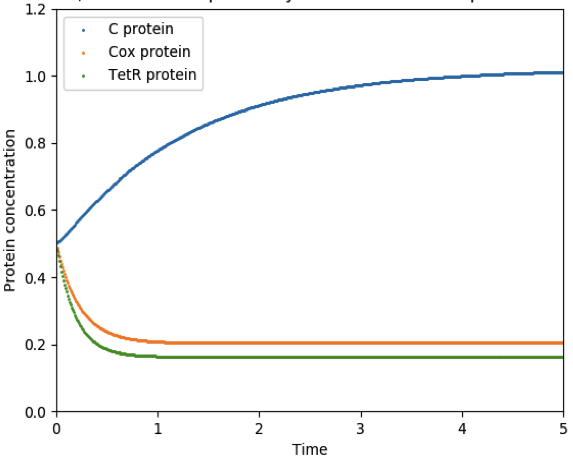
It depicts that C protein increases exponentially up to a certain concentration (x=0.8) and stabilizes after a certain time point, in this case t= 2 units. Cox and TetR protein seem to decrease in concentration up to a certain time point (t=0.5) and stabilizes at t=1.
In order to determine the steady state concentration, we examine the f(x) versus x [dx/dt v/s protein concentration] graph, from which we can tell the point where the graph crosses horizontal axis, corresponding to dx/dt=0, i.e. the steady state concentration.

We determine this concentration for C protein= 0.8 , Cox protein = 0.3, TetR protein=0.2
Simulating the model adapted to a stochastic setting results in a similar graph, which, however, includes more fluctuations due to random noise, introduced into the model.
