Phages are directed specifically against bacteria and thus represent no harm to humans. They are more specific, have longer shelf life and are cheaper to produce than e.g. antibodies. With Beeosensor it is now not only possible to detect vegetative Paenibacillus larvae bacteria but also its spores. With Beeosensor, we have proven that HB10c2 phages can detect spores of the causative agent of American foulbrood, which can in the future be used as a new detection method for AFB.
1. Optimizing Bacteriophage Sample Preparation
The first part of our project was the optimization of bacteriophage isolation for sensor measurements with the electrochemical impedance spectroscopy (EIS). For our purpose, it is necessary to produce high-quality bacteriophages with a high titer (10^10 PFU/mL). We focused on achieving the following goals for our bacteriophage preparation:
optimizing bacteriophage enrichment protocol in order to increase yield
finding reproducible methods for bacteriophage purification
Considering that there are several P.larvae bacteriophages candidates with different binding properties we decided to test HB10c2 as well as pHILBB_Pl23 bacteriophages on our sensor.
Anion-Exchange Chromatography Allows for An Easy Purification of Bacteriophages
After successfully enriching the HB10c2 bacteriophages to a high enough titer, purification was the next important step. The standard technique for this is ultracentrifugation using cesium chloride gradients. We tried to purify the bacteriophages with this technique but we either didn’t obtain sufficiently high bacteriophage concentration or isolation failed completely. Our conclusion was that this approach is both unmanageable and expensive.
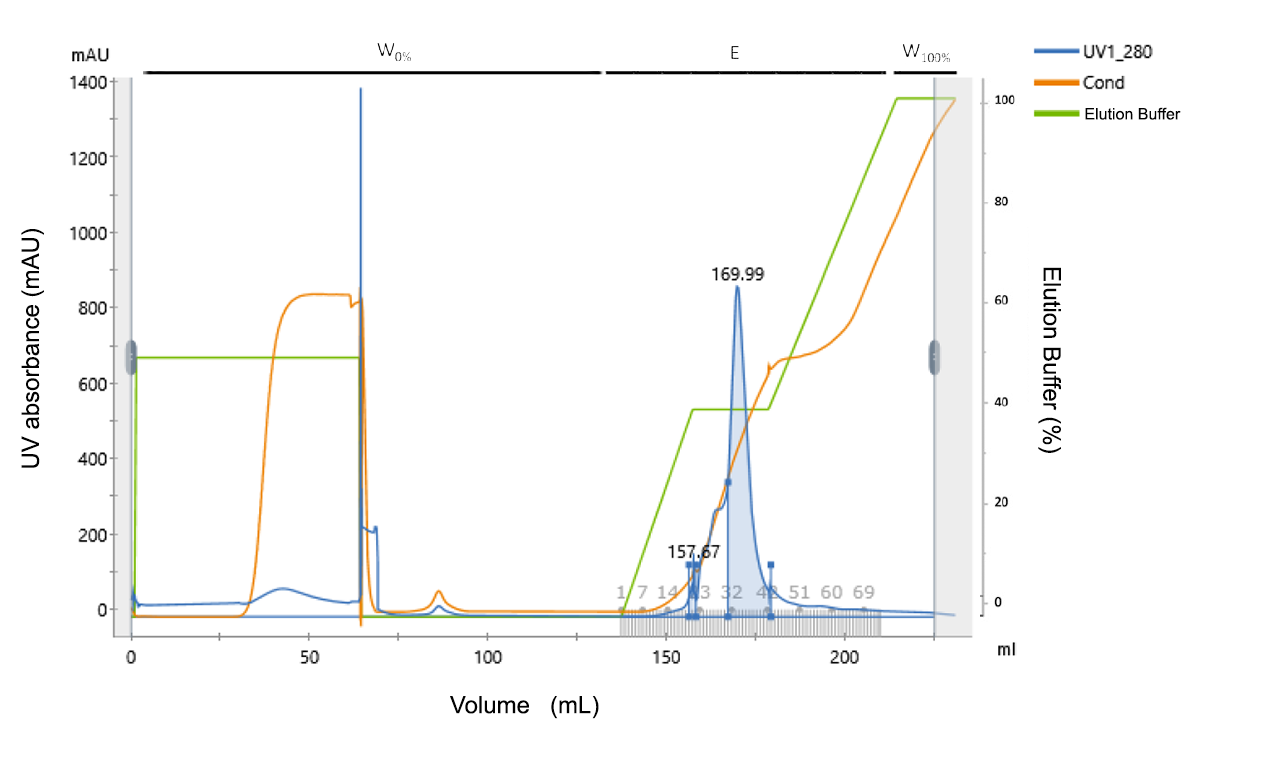
In searching of a better alternative we stumbled upon a bacteriophage purification protocol using Anion-exchange chromatography. Results are shown in Fig. 1.
Figure 1: Linear gradient of phage purification using a DEAE column. The UV absorbance (blue curve) is given at a corresponding elution buffer concentration (green curve). On top of the figure, the different phases in the
processes are indicated: Washing the column after loading (W0%), Elution (E) with the different
collected fractions indicated by numbers, and the final wash to regenerate the column (W100%).
Peak
Retention
Area
Area%
Fractions
Volume
Peak A
157.670
143.4
2.93
20-21
1.982
Preak B
169.992
4745
97.07
31-42
12.004
Peak A corresponds to bacteriophages which were collected in 1 ml fraction and sent to the sensor lab to do EIS measurements.
We found that using ion-exchange chromatography bacteriophages can be efficiently and easily purified so that the purified phages can meet quality criteria for EIS measurements.
2. Bacteriophage Spore Detection and Electrode Optimization
In literature, there have been a few known examples where bacteriophages did not only bind to vegetative bacterial cells but also to spores. A recent study claimed that there are even some P.larvae bacteriophages (unknown) that also bind to spore receptors [1]. To confirm this, we:
Additionally, we wanted to test different types of electrodes in order to select the best kind.
We found out that:
Immobilized HB10c2 bacteriophages produce a noticeable signal when AFB spores are loaded
Gold-screen-printed electrodes display best sensitivity and reusability
HB10c2 Bacteriophages Bind to AFB Spores
Comparing Results and Outlook
The most important difference for a practical application of our sensor is the charge transfer resistance RCT jump observed when the BSA and applied Paenibacillus larvae signals are compared (Fig. 2). In a control experiment, E. coli was used, resulting in response very similar to BSA, which proves the relative specificity of the biosensor.
Figure 2 : RCT Comparison of Different Bacteria Types
Top Layer
Charge Transfer Resistance
BSA (average)*
419[Ω]
E. coli
417[Ω]
Paenibacillus larvae (spores)
548[Ω]
Paenibacillus larvae (veg.)
793[Ω]
Fig. 2 shows an increase in RCT jump of about 30% (concerning the impedance after spore addition). The RCT jump for vegetative Paenibacillus larvae is with almost 100% by far the greatest. E.coli doesn’t seem to bond to our electrode, as seen by no increase in impedance. The RCT jump detected with Paenibacillus larvae spores indicates the spores bind only weakly or are too small to represent a high enough kinetic hindrance for charge transfer. To achieve a similar RCT difference as with vegetative bacteria, the search for different bacteriophages might be appropriate. The general method of binding bacteria via bacteriophages to an electrode, hence creating a biosensor, proved to be successful.
Gold-Screen-Printed Electrodes: sensitive and reusable electrodes
Graphite with Gold Nanoparticles
Working electrode: Graphite with Au-NP
Auxiliary electrode: Graphite
Reference electrode: Silver
The preparation was carried out as described in “Electrochemistry_Protocol”. The used screen-printed graphite electrodes unfortunatly showed a too low sensitivity for our measurements, as seen in Figure 3. The almost linear course of the impedance values also speaks for a mass transfer-controlled process. Since the semi-circles are not defined clearly enough, a charge transfer resistance cannot be calculated.
Figure 3 : Impedance spectra of a Graphite AU-NP Electrode
To make sure the problem was in the low sensitivity of our electrodes, rather than a mistake in our preparation process, the measurements were repeated with a highly sensitive glassy carbon electrode (Fig. 4).
Preparation was carried out as in “Electrochemistry_Protocol”, except that the glassy carbon surface had to be functionalized with gold nanoparticles. This was achieved by applying 10μL of colloidal Au-NP solution on our electrodes surface and letting it dry for about 1hour. After washing with MQ water, the procedure was continued as described in “Electrochemistry_Protocol”. Figure 2 now shows a steady rise in impedance, or charge transfer resistance so to speak. The results validated our basic procedure and made clear that graphite-gold SPE are not sensitive enough for our experiments.
Figure 4: Impedance Spectra of a Glassy Carbon Electrode
Top Layer
Charge Transfer Resistance
Bare
153[Ω]
Gold-NP
---
L-Cysteine
701[Ω]
Phages
1817[Ω]
BSA
3149[Ω]
Spores
3602[Ω]
As expected, the charge transfer resistance decreases through the application of gold and then rises again for every additional layer on the surface of the electrode. This is due to every chain segment added resulting in more sluggish reaction kinetics at the electrode double layer. The increased caused by the spores is too small to draw quantitative conclusions, which might be due to a small affinity between spores and bacteriophages.
Graphene with Gold Nano Particles
Working electrode: Graphene with Au-NP
Auxiliary electrode: Graphite
Reference electrode: Silver
The preparation was carried out as described in “Electrochemistry_Protocol”. The graphene Au-NP show a greater sensitivity then the graphite Au-NP counterparts. Although the semi-circles are not as well defined as with glassy carbon, a clear impedance rise is visible with continued electrode functionalization (Fig. 6).
Figure 5: Impedance Spectra of a Graphene-AuNP Electrode
Top Layer
Charge Transfer Resistance
Bare
---
L-Cysteine
42[Ω]
Phages
---
BSA
122[Ω]
Spores
152[Ω]
The RCT is not measurable for every step, but a steady increase is visible as predicted. The difference caused by the spores is still too low to make assured statements though.
Graphene with Electrodeposited Gold Nano Particles
Working electrode: Graphene with Au-NP (electrodeposited)
Auxiliary electrode: Graphite
Reference electrode: Silver
To compare the ordered graphene SPE (coated with gold nanoparticles) witch graphene electrodes that had their nano particles electrodeposited, we used simple graphene electrodes and dipped them in 5mM K[AuCl4] solution (in 0.5 M H2SO4). The electrode was then held at a constant potential of -0.7V for 300s. The electrodes were washed, and preparation was carried out as described in “Electrochemistry_Protocol”.
Figure 6: Impedance Spectra of a Graphene Electrode
Just as with the glassy carbon electrode, the charge transfer resistance decreases due to the gold nanoparticles and rises again for each functionalization step (Fig. 7). The semi-circles aren’t as well defined as in Figure 2 though. Compared to the graphene electrode with coated Au-NP, this electrode shows a much lower impedance, ranging only from 20-30 ohm, compared to the 20-65 ohm of Figure 3. This indicates a higher surface area of gold.
Top Layer
Charge Transfer Resistance
Bare
---
Gold-NP
---
L-Cysteine
---
Phages
42 [Ω]
BSA
55[Ω]
Spores
74[Ω]
Graphene Oxide with Gold Nano Particles
Working electrode: Graphenoxide with Au-NP
Auxiliary electrode: Graphite
Reference electrode: Silver
Preparation was carried out as described in “Electrochemistry_Protocol”. As all measurements, the impedance spectra show the expected course (Fig. 8), but with graphene oxide, the semi circles are not sufficiently defined to be interpreted quantitatively. Hence, this electrode type was not used for further experiments.
Figure 7 Impedance Spectra of a Graphene Oxide-AuNP Electrode
Gold Electrodes
Working electrode: Gold
Auxiliary electrode: Gold
Reference electrode: Silver
The screen-printed gold electrodes were polished on a polishing cloth with an alumina/MQ slurry of 1.0, 3.0 and 0.05μm respectively. The electrodes were then thoroughly washed with MQ and acetone. To remove hydrocarbon contaminations, the electrodes were cleaned with piranha solution (7:3 concentrated H2SO4 and 30% H2O2), which was diluted 1:3 with MQ. After being submerged for 5 minutes, they were taken out of the acid and rinsed intensively with MQ water. They then were prepared as described in“Electrochemistry_Protocol”.
Figure 8: Impedance Spectra of a Gold Electrode
Top Layer
Charge Transfer Resistance
Bare
39[Ω]
L-Cysteine
57[Ω]
Phages
85[Ω]
BSA
152[Ω]
Spores
181[Ω]
With all semi-circles being well defined, the screen-printed gold electrodes show a sensitivity comparable to the glassy carbon electrode (Fig. 9). The most important change in transfer resistance is the difference between the impedance after blocking with BSA and after applying spores. With roughly 29 Ω it is noticeable, but not large enough to confirm the presence of spores in a field test. This might be due to impurities in the HB10c2 bacteriophage sample, a too low affinity between spores and bacteriophages or too small kinetic hindrance provided by Paenibacillus larvae.
Since the gold SPE showed by far the most sensitivity, further experiments focused on this type of electrodes.
3. Device Testing
After successful confirmation of the bacteriophage-spore binding and electrode optimization in the sensor lab, we wanted to develop an on-field impedance measuring device that could reproduce same measurements as the lab sensor. We constructed an affordable device and performed a series of measurements.
Comparison Measurements: Metrohm Autolab vs Beeosensor
In this test, we wanted to examine the accuracy of our self-made sensor (containing the ADuCM355 chip). We compared the values to the laboratory potentiostat (Metrohm Autolab). The measurements were conducted one after another, with a polished Gold-Screen-Printed electrode.
Figure 9: Impedance Spectra of a polished Gold Electrode with Metorhm Autolab and ADuCM355 Sensor
The results (Fig. 10) show very high similarity in RCT.
We found out that a cheap device can be built with the ADuCM355 chip, which can achieve accuracy comparable to the Lab EIS sensor.
4. Further Experiments
To identify the receptor-binding protein of the phage, we modeled the most promising candidates from the published genome of HB10c2 and conducted an experiment to show the binding of the protein to P. larvae.
The use of relatively sizeable tags such as C-LytAm7 (136 aa) may help the immobilized protein of interest to avoid steric hindrance with the support and to increase its mobility. Additionally, the C-LytAm7 shows higher kinetic stability and higher denaturation temperatures (up to 90 °C) than the wild-type C-LytA []. That’s why we wanted to test the simplicity and efficiency of the purification step of C-LytAm7 affinity tag.
Identification of the Receptor Binding Protein (RBP)
In silico
The modeling with Phyre2 resulted in a protein resembling RBPs known from other bacteriophages. As the protein is a trimer, perfect modeling was not expected and the results were convincing enough to proceed.
Modeling the trimer with GalaxyHomomer resulted in a structure that looks very similar to other RBPs.
To prove the binding characteristics of the protein, cells harboring the plasmid containing the candidate RBP gene and cells with the same plasmid containing a different protein were grown, transferred onto nitrocellulose membranes and lysed there. The recombinant protein would then bind to the membrane and the colony debris is removed. P. larvae should now have bound only to the spots of the RBP-containing cells and not to the other ones. The blocking of the membrane might not work good enough in all cases so the membrane was covered in P. larvae colonies, but 6 spots showed anomalies and could be matched to former RBP-colonies, while none of these spots could be matched to non-RBP-spots.
Conclusion
These results suggest that the candidate protein might bind P. larvae and combined with the modeling, which results in a very RBP-like structure, we assume that the protein candidate is the RBP of the Paenibacillus phage HB10c2.
Overexpression and Purification of C-LytAm7
E. coli cells with a C-LytAm7 containing plasmid were grown in 3x 800 mL LB Broth cultures, 140 rpm, overnight. The cultures were then induced with IPTG in order to induce protein expression. A 1 mL aliquot was taken before the induction as a control sample. Cells were then harvested, sonicated and applied on a DEAE-Sepharose Fast-flow column (20 mL). The column was washed first with five column volumes of ice cold 0.05 M Tris-maleate buffer, pH 7.0. Second wash was done with five column volumes of the same wash buffer plus 1.5 M NaCl, and then eluted with the ice-cold 0.05 M Tris-maleate buffer, pH 7.0, 1.5 M NaCl, 2 % choline. Fractions were analyzed for homogeneity by SDS-PAGE (Fig. 11).
Figure 10: Ion-Exchange Chromatography of E.coli total extract on DEAE-Sepharose column and assessment of fraction homogeneity by SDS-PAGE. Lane 1 shows a PageRuler™ Prestained Protein Ladder, 10 to 180 kDa; lanes FT1 and FT2 show the flowthrough; lanes W1 and W2 show the first and second wash fractions, respectively; Control shows the uninduced E.coli samples; lanes E1-E4 show the eluted fractions.
SDS-PAGE shows that the overexpression and purification of the C-LytAm7 (15 kDA) yielded high amount of recombinant protein with high purity.
Cell free system
The only just begun experiments for the cell free system have shown that the phage DNA could be successfully isolated by phenol-chloroform precipitation. The gene of the putative RBP was amplified by PCR from this DNA. This DNA will then be used as a “template” for the assembly of phages in the cell free system, containing lysed cells and the special buffer we got from Team Munich.