Team:Austin UTexas/Parts
PARTS
VALIDATED PART/VALIDATED CONTRIBUTION
We designed 5 new parts to function as 'calibration strains' for our burden measurements. Each of these 5 parts contained a promoter of either strong or medium strength, an RBS of either strong, medium, or weak strength, and a BFP reporter. The purpose of these parts was to act as a 'standard' around which we could model our burden regression line, which represents the relationship between the translational burden imparted by the promoter/RBS and gene expression.
Measuring the growth rates of the new parts
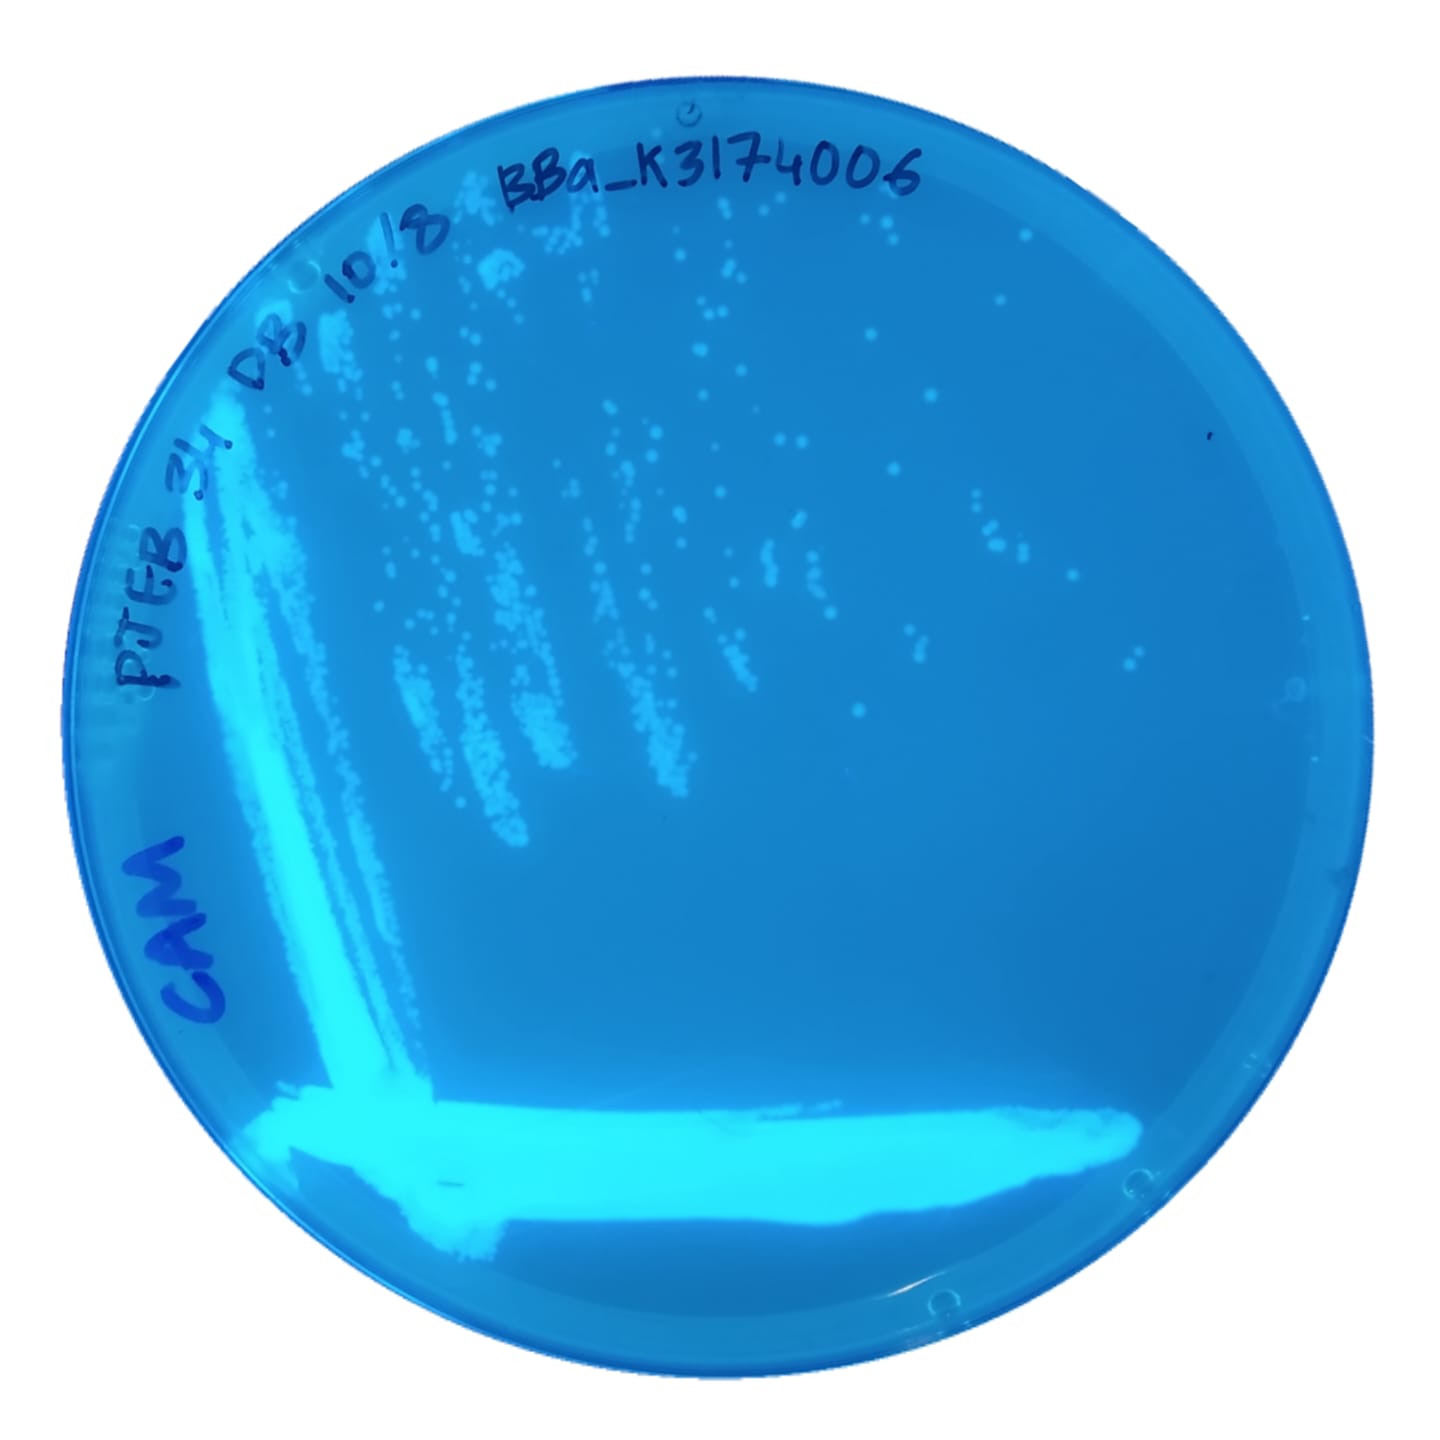
Visualization of growth rates for the 5 BFP plasmids in TOP10 cells streaked onto LB + CAM plates from glycerol stocks, and viewed under a UV light: (left to right) BBa_K3174002, BBa_K3174003, BBa_K3174004, BBa_K3174006, and BBa_K3174007. BBa_K3174002 and BBa_K3174003 have very small fluorescent colonies, BBa_K3174004 has bigger colonies, and BBa_K3174006 and BBa_K3174007 have the largest colonies. The disparity in these growth rates originates from the variation in metabolic burden imposed on each strain due to their relative promoter and RBS strengths.

BBa_K3174002
Strong promoter, strong RBS

BBa_K3174003
Strong promoter, medium RBS

BBa_K3174004
Strong promoter, weak RBS
BBa_K3174006
Medium promoter, medium RBS

BBa_K3174007
Medium promoter, weak RBS
Once we had observed growth rates of each of these 5 parts, we wanted to see if the BFP expression levels matched our expectations based on what we know about the promoter strength of each part. We did this by selecting 3 colonies from each of these 5 plates and growing them in 5mL overnight LB + CAM cultures. We then placed 4 replicates of each isolate into a 96 -well plate (using 200uL of culture for each well) and took a single BFP measurement for each well. The resulting data is depicted in the Fig.2 bar plot below.
Findings from the BFP Measurements Plot
- We expected BBa_K3174002 and BBa_K3174003 to have the highest BFP expression levels because these parts have the strongest promoter/RBS combinations. Surprisingly, we found that they had the lowest level of BFP expression. We hypothesized that the cells with the intact genetic devices must have been under a high level of metabolic stress, resulting in loss-of-function mutations that contained a 'broken' genetic device (making these cells express lower levels of BFP). The new mutated cells, with their fitness advantage over the highly burdened intact cells, must have then quickly overtaken the population.
- We expected BBa_K3174004 to have a BFP expression level that was lower than BBa_K3174002 and BBa_K3174003 but higher than BBa_K3174006 and BBa_K3174007. However, it instead had the highest level of BFP expression out of all 5 parts. This is probably due to the fact that it had a strong enough promoter to cause BFP to be expressed strongly but a weak RBS that prevented considerable stress to the cell. It is important to note that although BBa_K3174004 expressed BFP at the highest level, it lacked consistency between each of the four replicates for each isolate.
- BBa_K3174006 and BBa_K3174007 expressed BFP as expected. They had the second and third highest BFP expression levels respectively. Both these parts have relatively weaker promoters that are unlikely to cause burden to the cell. They seemed to have the highest consistency between replicates.

These 5 constructs had their sequences confirmed via Sanger Sequencing.
The major takeaways from this measurement data are:
- BBa_K3174002 and BBa_K3174003 should be used with caution because they break almost immediately due to a high level of metabolic stress to the cell that causes loss of function mutations, leading to a population of cells that no longer express BFP at a high level.
- BBa_K3174004 expresses BFP at the highest level but probably does not have very high stability based on the inconsistency in BFP expression measurements between replicates of each of the three isolates depicted in the bar graph above.
- BBa_K3174006 and BBa_K3174007 express BFP at low levels but appear to be the most stable based on the consistency in BFP expression measurements between replicates of each of the three isolates depicted in the bar graph above. These parts could be useful for experiments that do not require high levels of BFP expression but do rely on evolutionary stability.