Team:Austin UTexas/Model
Modeling
Overview
A major problem in synthetic biology is evolutionary instability: when a genetic construct is transformed into to a cell, some resources are allocated towards expression of the construct. This introduces a cellular resource competition between it and the host genome, creating additional cellular burden. This makes engineered bacterial populations less fit than the wild type. Over time, cells accumulate loss-of-function mutations within the construct, freeing cellular resources for the genome and increasing cell fitness. The population cannot withstand the burden associated with the construct for a sustained number of generations, so individual cells' constructs evolve as a way to relieve this burden and, eventually, the mutation sweeps the population. When this happens, production levels of the construct lessen significantly! This is more likely to happen at an earlier number of generations if the burden imposed by the construct is greater, which means that the part is more evolutionarily unstable. Our model quantitatively predicts the effects of burden and escape rate on the evolutionary stability of a genetic part in order to help scientists understand the consequences of using one construct over another.
Based on the paper “Diverse genetic error modes constrain large-scale bio-based production” by Rugbjerg et al (2018), our model provides a powerful tool to predict part breakage. Our model, like the Rugbjerg model, is meant to show the reduction in the fraction of producing cells within a population over time (in generations) based on production load and escape rate.
Before we can explain our model, these terms need to be defined…
Rugbjerg defines production load as the “fitness cost… [that] arises from metabolic loads… [or] the accumulation of toxic intermediates and by-products.” [1] Mathematically, production load is defined as:

This equation explains production load as the expenditure of cellular resources, denoted as 1 minus the growth rate fraction of producers over non-producers.
Escape rate (kescape) is the rate at which non-producers arise out of an existing population of producers as caused by mutations decreasing the function of the construct.
To reiterate more simply, our model shows when parts break within a population of E. coli according to that part’s burden value. Therefore, our model marries the concepts of burden and evolutionary stability within our project to create a predictive tool simulating the evolutionary stability of parts based on their burden values. The variable parameters in the original equation in Rugbjerg’s study are the escape rate and production load of a construct. We adjusted the parameters of the equation to serve our purposes. Our definition of escape rate remains the same in our model, but our analog to production load is our burden value (b). The burden value is defined as (1-μ). Higher burden values (percent reduction in growth rate), correspond to parts breaking at an earlier generation time. For example, a part that has a burden value of 0.4 and thus imparts a 40% reduction in growth rate, will have 0% fraction of cells producing that part in an isolated population after 50 generations has passed (Figure 1). This means that if a scientist wanted to propagate cells containing this part to a saturated culture in a 200 liter tank, 0% of the cells in that population would be producing the part of interest. Therefore, cells from that culture would be unproductive to use for further propagation, because the construct has “failed.”
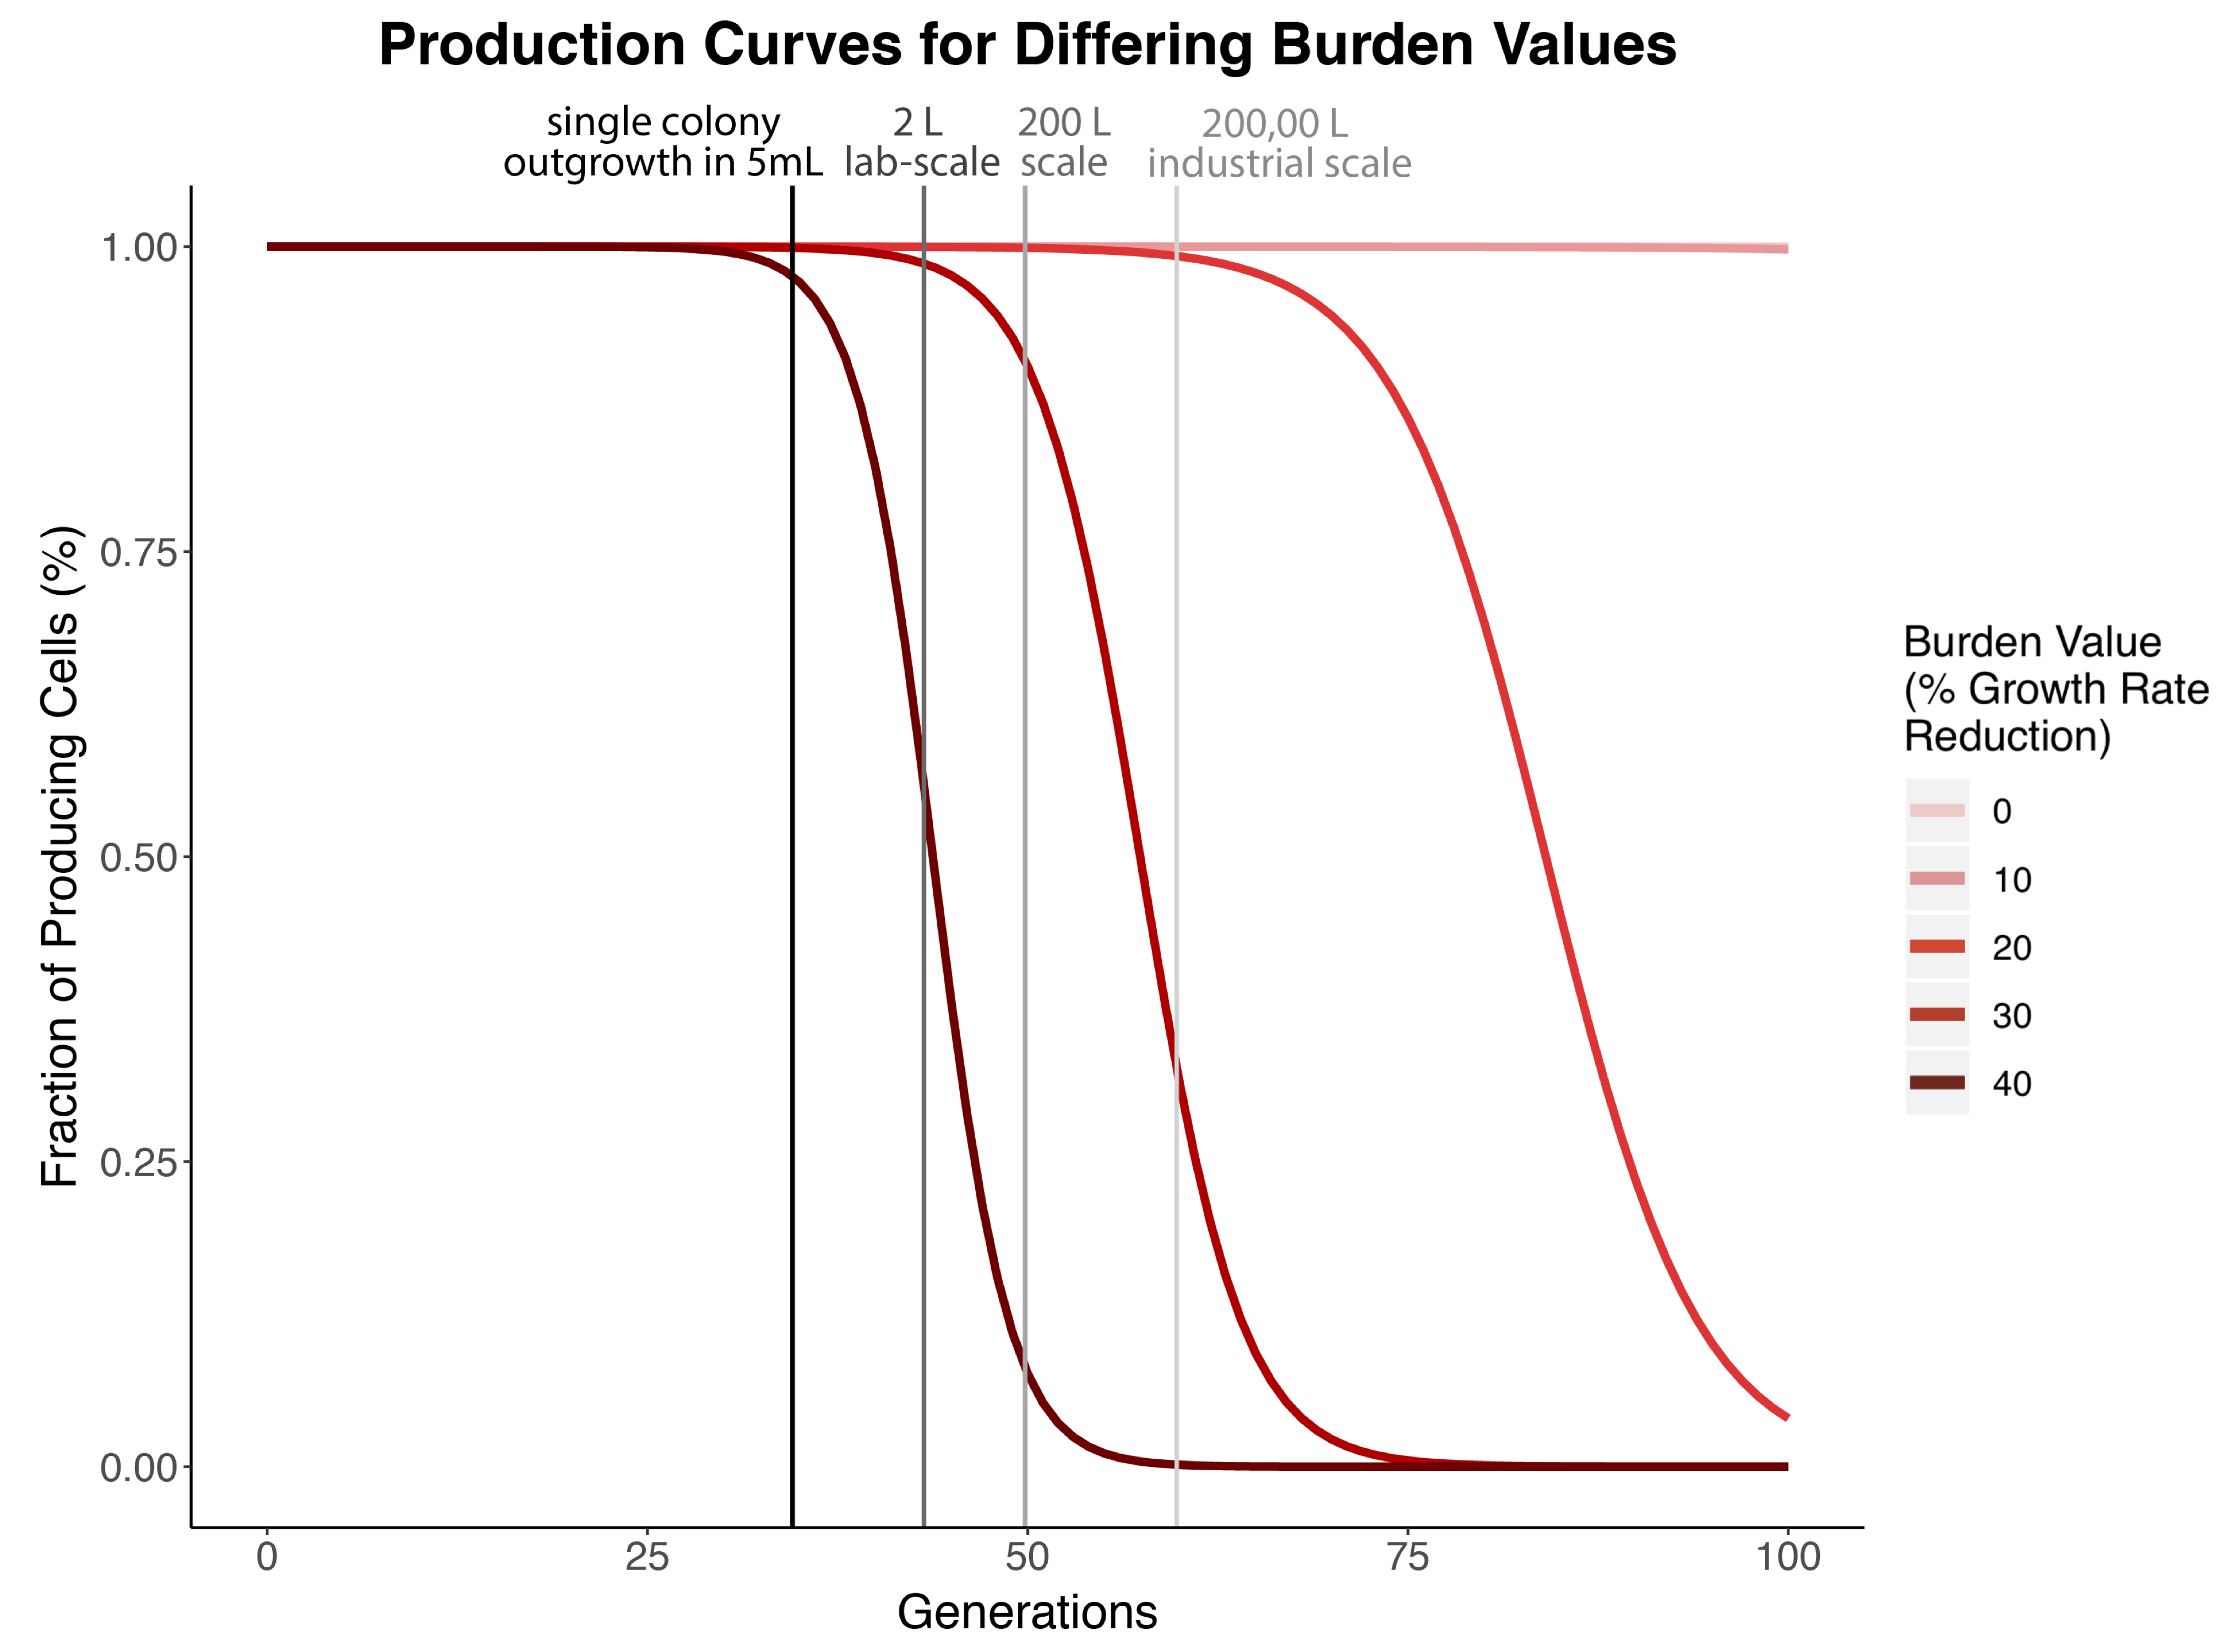
Figure 1. The figure above shows the production curves for gradually increasing burden values with darkest red curve being 40%, decreasing by 10% for each lighter color until the lightest value, being 0%. The escape rate here is fixed at k = 10-8. The vertical lines represent the generation time passed for saturation of different volumes, with the darkest gray representing laboratory uses for a single colony outgrowth in 5 mL and the lightest gray representing industrial applications at 200,000 liters. If a burden results in 0% producing cells before the generation time required for a 5mL culture to become saturated, then that part is unclonable because it is too burdensome.
Equations and Calculations
Our model is based on mathematical equations outlined in the Rugbjerg et al 2018 paper. Rugbjerg developed a model to show the effects of escape rate and production load on the percent fraction of part-producing cells within a population. Similarly, our model investigates the relationship between burden and escape rate with the percentage of plasmid-expressing cells. In order to reach the final modeling equation, we first had to mathematically define two observations: (1) producers dissipate within a population depending on the escape rate and the production load , and (2) non producers increase in a population depending on the escape rate and production load. This is denoted in the following two equations:

The upper equation shows how the population of producing cells changes over time based on growth rate and escape rate. Furthermore, it explains how the amount of producers will dissipate in a population according to the escape rate and production load. The lower equation shows how the population of non-producing cells increases based on the escape rate and production load.
These equations are important because they convey how mutations in producers will contribute to the amount of non-producers within the population. By solving these two equations, Rugbjerg was then able to derive their final equation for the fraction of producing cells at a given time using production load, ρ. Thus, Rugbjerg's equation to describe the fraction of producing cells at a given time is:

Our model works with burden value rather than production load. These two values are exactly the same. Therefore, we replace production load (ρ) with burden value (b). Our burden value is the percent reduction in growth rate:

Burden is the specific growth rate of producers subtracted from 1, resulting in the producer's reduction in growth rate. Just as our burden analysis normalizes our burden values to a mean maximum growth rate of 1, our model also normalizes the specific growth rate of non-producing cells to 1. Thus, the burden value can be calculated by subtracting the specific growth rate of producers from 1. The basis of this equation is the same as Rugbjerg's equation for production load; however, we can eliminate the specific growth rate of non-producers as it is always 1.
Using Rugbjerg’s equations as a foundation, we derived our final equation relating burden, escape rate, and fraction of part-expressing cells. This was done by simply replacing the production load value with our burden value: (Note: below is supposed to be a series of equations translating production load to burden value. Unfortunately, it is not appearing on all devices. Sorry for the inconvenience!)


Our modeling equation simply translates Rugbjerg’s equations in terms of burden. We replace ρ (production load) with burden value (percent growth rate reduction). This model functions under the assumption that a single, plasmid-expressing cell was inoculated at generation 0.
For the purposes of our model, we kept the escape rate constant at 1x10⁻⁸. This escape rate was chosen, because it is close to the mutation rate we would expect to see for a majority of the parts we assayed and parts in the iGEM Registry. Rugbjerg’s model incorporated two escape rates: a low rate of 1x10⁻⁸ and a high rate of 1x10⁻⁵. An escape rate of 1x10⁻⁸ is representative of a basal mutation rate level just slightly higher than the rate of a single point mutation. We would expect that the standard escape rate is higher than that of a single point mutation, thus this value was most logical for displaying the effect of burden on the fraction of plasmid-expressing cells. An escape rate of 1x10⁻⁵ is representative of genetic devices with insertion elements, repeated sequences, and/or cell lines with broken repair mechanisms. These factors make genetic sequences more prone to mutation, leading to this higher escape rate. Although we kept the escape rate constant in Figure 1 to display the effect of burden on production, we also created an interactive model for the Shiny app that allows users to adjust both burden value and escape rate. This encourages users to explore the range of effects that both burden and mutation rate incur upon plasmid breakage. Additionally, users can change the volume of the culture to determine at which saturated volume their part will break. Our interactive simulation can be found on GitHub/barricklab/igem2019 as “producer_simulation.R.”
Application and Significance
Our major insights from this model helped us troubleshoot why certain data were unusable and why some parts we researched for cloning did not work for other teams. Based on our model, we were able to determine that some parts were so evolutionarily unstable that they broke too early to determine their burden. We assume that there is only one type of mutation affecting the escape rate to alleviate burden with no interaction between producers and non-producers, and that this mutation only affects the cell's ability to produce a part, and nothing else. In addition, we assume that producers mutate completely into non-producers within a population and that non-producers are more stable than producers, thus non-producers outcompete producers in a population.
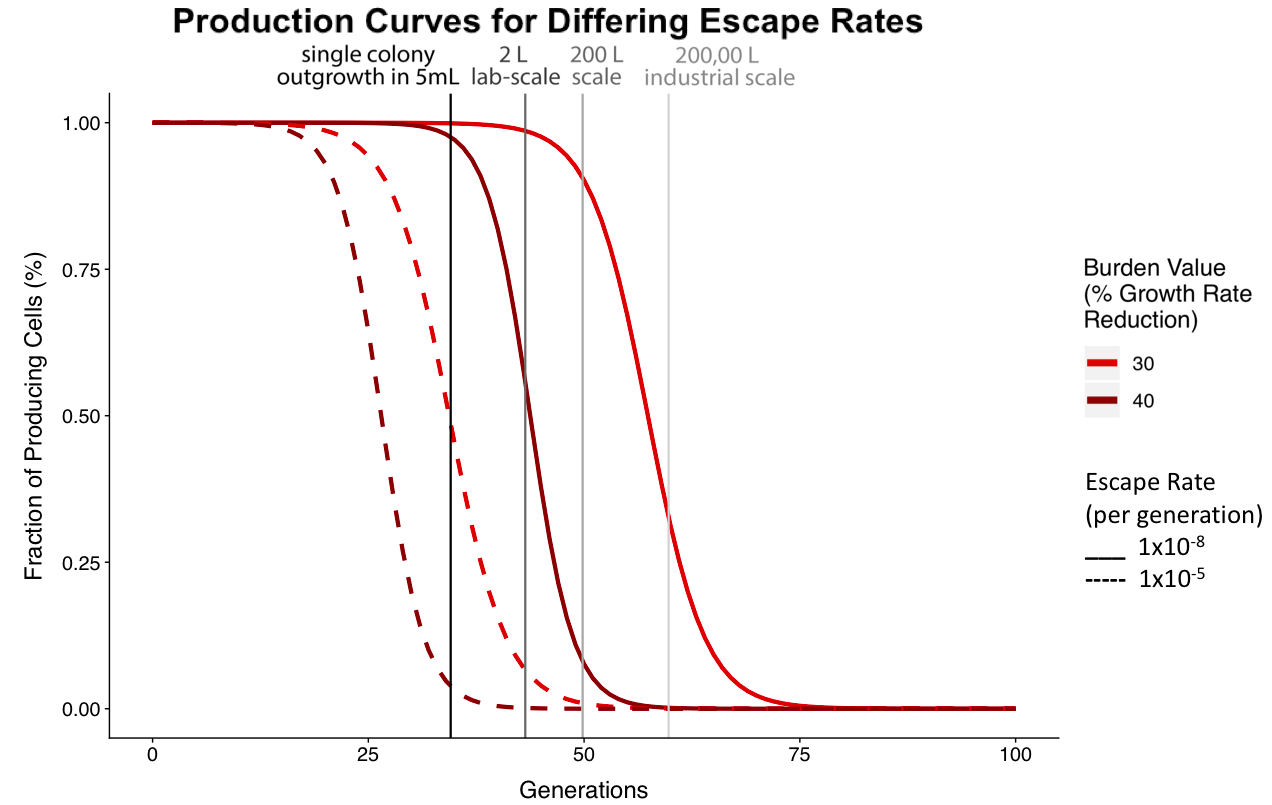
Figure 2. The figure above shows the fraction of producing cells after 100 generations for varying escape rates. The solid line shows the production curve of a culture with an escape rate of 1x10⁻⁸ and the dashed line shows the production curve of a culture with an escape rate of 1x10⁻⁵. These data show that as escape rate increases, the construct will break after fewer generations.
Using our model in conjunction with our burden measurements, we can better understand the evolutionary stability and consequences of using genetic constructs for real world applications. This model communicates the effects of burden, mutation rate, and volume on the stability of these constructs. The interactive component of our model allows scientists to explore the stability of specific constructs. Synthetic biologists can use this model to make more informed decisions about what genetic parts they want to use in long-term or large-scale experiments. For example, the larger the culture volume, the faster the construct will break before reaching saturation. This is important information for product yield in large industrial applications, thus making this model invaluable to many fields, including industry, medicine, bioremediation, and biofuels.
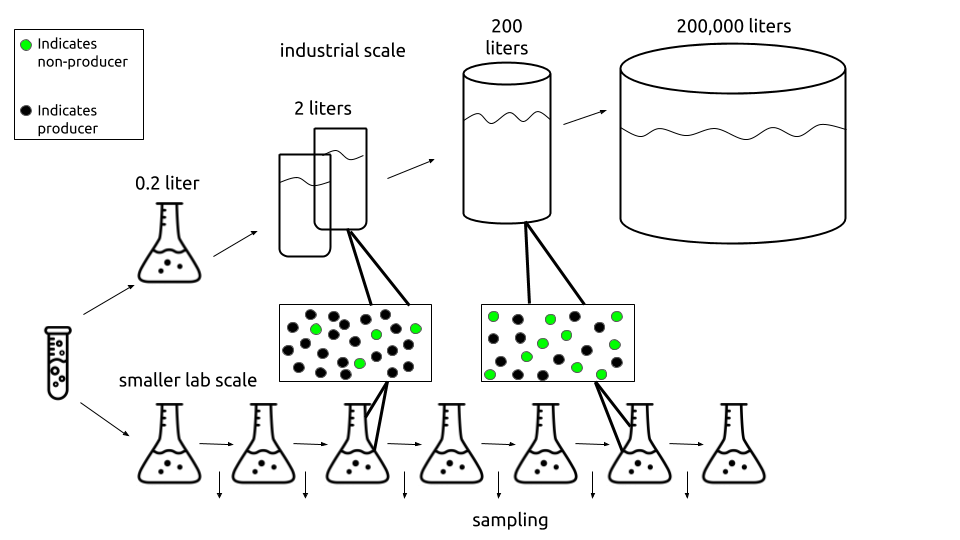
Figure 3. As volume of culture increases, the construct will break after fewer generations as indicated by the increased amount of non-producers. This figure is inspired by the Rugbjerg paper. Flask and test tube graphics created by Atif Arshad from Noun Project.
A 200,000 liter industrial scale culture will reach saturation at around 59.8 generations. According to our model, the cells in this industrial scale setting will break (and the non-plasmid-expressing cells would take over the population) before the culture reaches saturation for any burden value greater than 20%. Therefore, scientists using large volumes for industrial experiments should try to work with constructs that have a burden value less than 20%. Another way to prevent faster breakage is to attempt to reduce the escape rate, because lower escape rates shift the production curves for various burden values to the right (Figure 2). Reducing the burden value of a construct could be achieved by altering promoter strength. As detailed in our measurements of the Anderson Series promoters on our Demonstrate Page, a stronger promoter is correlated positively with burden. Thus, exchanging a construct's promoter for a weaker one may help reduce the construct's burden value and increase the number of generations that may pass before the construct breaks. Similarly, escape rate can be lowered by editing "mutation prone" sections of the genetic sequence, such as insertion elements and sequence repeats. However, this may be easier said than done - in some cases, it may not be possible to alter the expression or sequence of the construct in use. An alternative method of lowering burden is using an inducible promoter. This allows scientists to choose when expression is on and off (and thus when cell resources are being depleted).
Our model is a powerful tool for understanding and visualizing construct breakage. It directly informs the design of both lab-scale experiments and large industrial-scale experiments. Through the use of our model, scientists can find more efficient methods of using engineered organisms.
References
[1] Rugbjerg, P., Myling-Petersen, N., Porse, A., Sarup-Lytzen, K., & Sommer, M. O. A. (2018). Diverse genetic error modes constrain large-scale bio-based production. Nature Communications, 9(1). doi: 10.1038/s41467-018-03232-w