Team:GO Paris-Saclay/Model

A brief introduction
We developed the first model of DNA-less cell fate. We started from an established deterministic model of bacterial cell growth. We modeled the absence of DNA as a stop to all transcription, and adapted the initial hypotheses of Weiße and al. (PNAS, 2015) [1] and specify information about protein quantities and DNA elimination based on our experimental data. Throughout the whole modeling process biologists and mathematicians have worked side by side to use the best of both disciplines. This close collaboration allowed us to kept in mind some real aspects of the mathematical tools we were using. To improve our model, we met Guillaume Terradot (Edinburgh) who is a specialist of the model written by Weiße and al. [1]. This discussion was very productive. He gaves us several advices to adapt the model to the particular case of DNA-free cells. The predictions of our model were in agreement with our experimental results and permitted to us to draw conclusions about the metabolic activity remaining in DNA-less cells and their potential for use as factories. Challenged by the original experimental results obtained by the team (less RNA phages produced by the DNA-less cells), we modeled the replication of an RNA parasite within DNA-proficient and DNA-deficient cells. We simulated phage infection and noticed a reduced phage burst size correlated to ribosome depletion in DNA-less cells. In conclusion, our model efficiently brings to light original phenotypes of DNA-less cells.
Construction of the mathematical model to describe DNA-free cell
Model Explanation
How the model works ?
The model is composed by thirty equations based on the mathematical model of [1]. Each equation describes one constituent quantity of the bacteria: nutrients, energy, RNAs, proteins... For every ”dt” time interval, each component quantity is modified. For instance the energy quantity, is increasing by the transformation of the nutrient but reduced by it utilization in the translation process. The purpose of the model is to describe what happens in a E.coli bacteria when DNA is removed. The simulation is articulated in two stages. The first one, the initialization, simulates bacteria growth in normal condition. The second stage corresponds to DNA elimination. Indeed, we continued the same simulation, but we modified the value of some parameters to mimic the effect of DNA degradation. Especially, DNA degradation was introduced in the model by considering that transcription was decreased after the induction of nuclease expression
The nutrient quantity
The variation of the nutrient quantity is depending on : $$ \frac{ds_{i}}{dt} = v_{imp}(e_{t},s)-v_{cat}(e_{m},s_{i})-\lambda s_{i}, $$ where $v_{imp}$ is the import rate of nutrient from bacteria environment. It depends on the quantity of proteins involved in nutrient transport $e_{t}$ and the nutrient quantity outside the bacteria $s$ which is considered constant. $$ v_{imp}(e_{t},s)=e_{t}\frac{v_{t}s}{K_{t}+s}. $$ $K_{t}$ is the threshold amount of nutrient inside the bacteria when the metabolism rate is half-maximal. Here $v_{cat}(e_{m},s_{i})$ is the metabolism rate, the rate of transformation of nutrient in energy. It depends on the quantity of enzymes involved in primary metabolism $e_{m}$ and on the nutrient quantity inside the bacteria $s_{i}$. $$ v_{cat}(e_{m},s_{i})=e_{m}\frac{v_{m}s_{i}}{K_{m}+s_{i}}, $$ where $K_{m}$ is the threshold amount of nutrient inside the bacteria where the metabolism rate is half-maximal. $\lambda$ is the dilution rate. In our model there are no effective division, but at every step of time all quantities are reduced in proportion to their values.
The energy quantity
The variation of the energy quantity is depending on : $$ \frac{da}{dt} = v_{cat}(e_{m},s_{i})-\sum_{x}n_{x}v_{x}-\lambda a , $$ $v_{cat}(e_{m},s_{i})$ is the metabolism rate, the transformation of nutrient in energy. We made the approximation that energy use is only due to the translation process. The sum over x is over all types of proteins in the cell, the energy quantity is reduced by energy consumed during each translation process happening during the step time. The energy which is consumed for protein translation depends on the size ($\sim $ how much it is difficult to translate it) of the translated protein: $n_{x}$, and the translation rate of this protein : $v_{x}$ ($\sim $ quantity of the protein which is produced at each step).
The RNA and ribosome quantities
Ribosome are nanomachines (composed of ribosomal RNA and proteins) that ensure the 'translation' process i.e. the production of proteins encoded by messager RNAs (mRNAs). The ribosomes bind mRNAs (which encode proteins), 'read' them and catalyze the step-by-step addition of aminoacids, leading to protein synthesis. In this model, we considered differently free ribosomes (not involved in a translation process) and ribosomes bound to mRNAs (actively translating mRNA), these later being named 'bound ribosomes' $c_{x}$. From this quantity depends the translation rate of a protein: $$ v_{x}=\frac{\gamma (a)}{n_{x}}c_{x}, $$ and where $\gamma (a)$ is the effective rate of protein elongation: $$ \gamma (a)=\frac{\gamma _{max} a}{K_{y}+a}. $$ $K_{y}$ is the threshold amount of energy where elongation is half-maximal and $\gamma _{max}$ is the maximal elongation rate. When a translation event is done, the mRNA-ribosome complex dissociates so that the mRNA and the ribosome turn back to the pools of 'mRNA-quantity' and 'free-ribosomes', respectively. It gives this equation for the pool of 'bound ribosomes': $$ \frac{dc_{x}}{dt}= k_{b} m_{x}r-k_{u} c_{x}-v_{x}-\lambda c_{x}, $$ $k_{b} $ and $k_{u}$ denote the rates of binding and unbinding of a ribosome to an mRNA (assumed identical for all mRNAs), the mRNA quantity encoding a protein x is $m_{x}$ and the free-ribosome quantity is $r$. It gives the equation for the 'free-ribosomes' pool: $$ \frac{dr}{dt}=v_{r}-\lambda r + \sum_{x}[ v_{x} -k_{b}m_{x}r+k_{u}c_{x}]. $$ In consideration of the mRNA degration rate $d_{m}$ the equation for the mRNA quantity is: $$ \frac{dm_{x}}{dt}=\omega_{x}(a)-k_{b}m_{x}r+k_{u}c_{x}+v_{x}-d_{m}m_{x}-\lambda m_{x}, $$ where $\omega _{x}$ is the rate of transcription and $x$ $\in \left\{ e_{t}, e_{m}, r \right\}$ : $$ \omega _{x}= \frac{w_{x}a}{\theta_{x}+a}, $$ $w_{x}$ is the maximal transcription rate and $\theta _{x}$ is the threshold amount of energy at which transcription is half-maximal. For $x=q$, the transcription rate is auto-regulated to sustain stable protein levels: $$ \omega _{q}= \frac{w_{q}a}{\theta_{q}+a} \times \frac{1}{1+(\frac{q}{Kq})^{h_{q}}}. $$
The protein quantity
In this model we are considering 4 proteins quantities: ribosomes $r$ (that have already been considered in 3.4), transporter enzymes $e_{t}$ which import nutrient inside the bacteria, metabolic enzymes $e_{m}$ which transform the nutrient inside the bacteria in energy. Some other proteins, such as structure proteins, that doesn't matter for the proper functioning of the model are considered as the house keeping protein quantity $q$. For transporter enzymes, metabolic enzymes and house keeping proteins quantities, we added to the original model a degradation rate $d_{x}=5 \times 10^{-4} \, min^{-1}$ according to this article [2], because in the second part of the model the only significant quantities remaining are the proteins, ribosomes and ATP quantities. We didn't add degradation rate for ATP because we are using this part of the model during only 200 min (after that experiments are stopped because bacteria are dying, and the model is no longer available), and during the first 25 min ATP consumption is just in time flow, and from 25 min to 200 min, after many simulation even with an ATP degradation, energy quantity is always in oversupply. We didn't add degradation rate for bound ribosomes and free ribosomes because their degradation, according to this article [3] is slower than proteins and not significant during the first 200 min. It gives these equations where $x$ $\in \left\{ e_{t}, e_{m}, q \right\}$: $$ \frac{dx}{dt}=v_{x}-(\lambda + d_{x})x. $$ To simplify we are considering $d_{e_{t}}=d_{e_{m}}=d_{q}.$
The $\lambda$ dilution term
The growth rate $\lambda$ is crucial to connect the cellular processes with growth, as it models the dilution of all intracellular quantities by redistributing the cellular content between mother and daughter cells. The total mass of the cell is defined as the total protein mass (including bound ribosomes), mass of other quantities being neglected: $$ M=\sum_{x}n_{x}x+n_{r}\sum_{x}c_{x}. $$ The mass of the bacteria is increased by the newly synthetized proteins and is reduced by protein degradation (the free-ribosomes degradation rate $d_{r}$ being 0) and dilution of proteins and bound-ribosomes: $$ \frac{dM}{dt}=\gamma(a)\sum_{x}n_{x}-\lambda M-\sum_{x}n_{x}xd_{x}. $$ The mass of a bacteria is considered as remaining constant during the first part of the model $\frac{dM}{dt}=0$. It gives: $$ \lambda=\frac{\gamma(a)\sum_{x}n_{x}-\sum_{x}n_{x}xd_{x}}{M}. $$
First part model summary
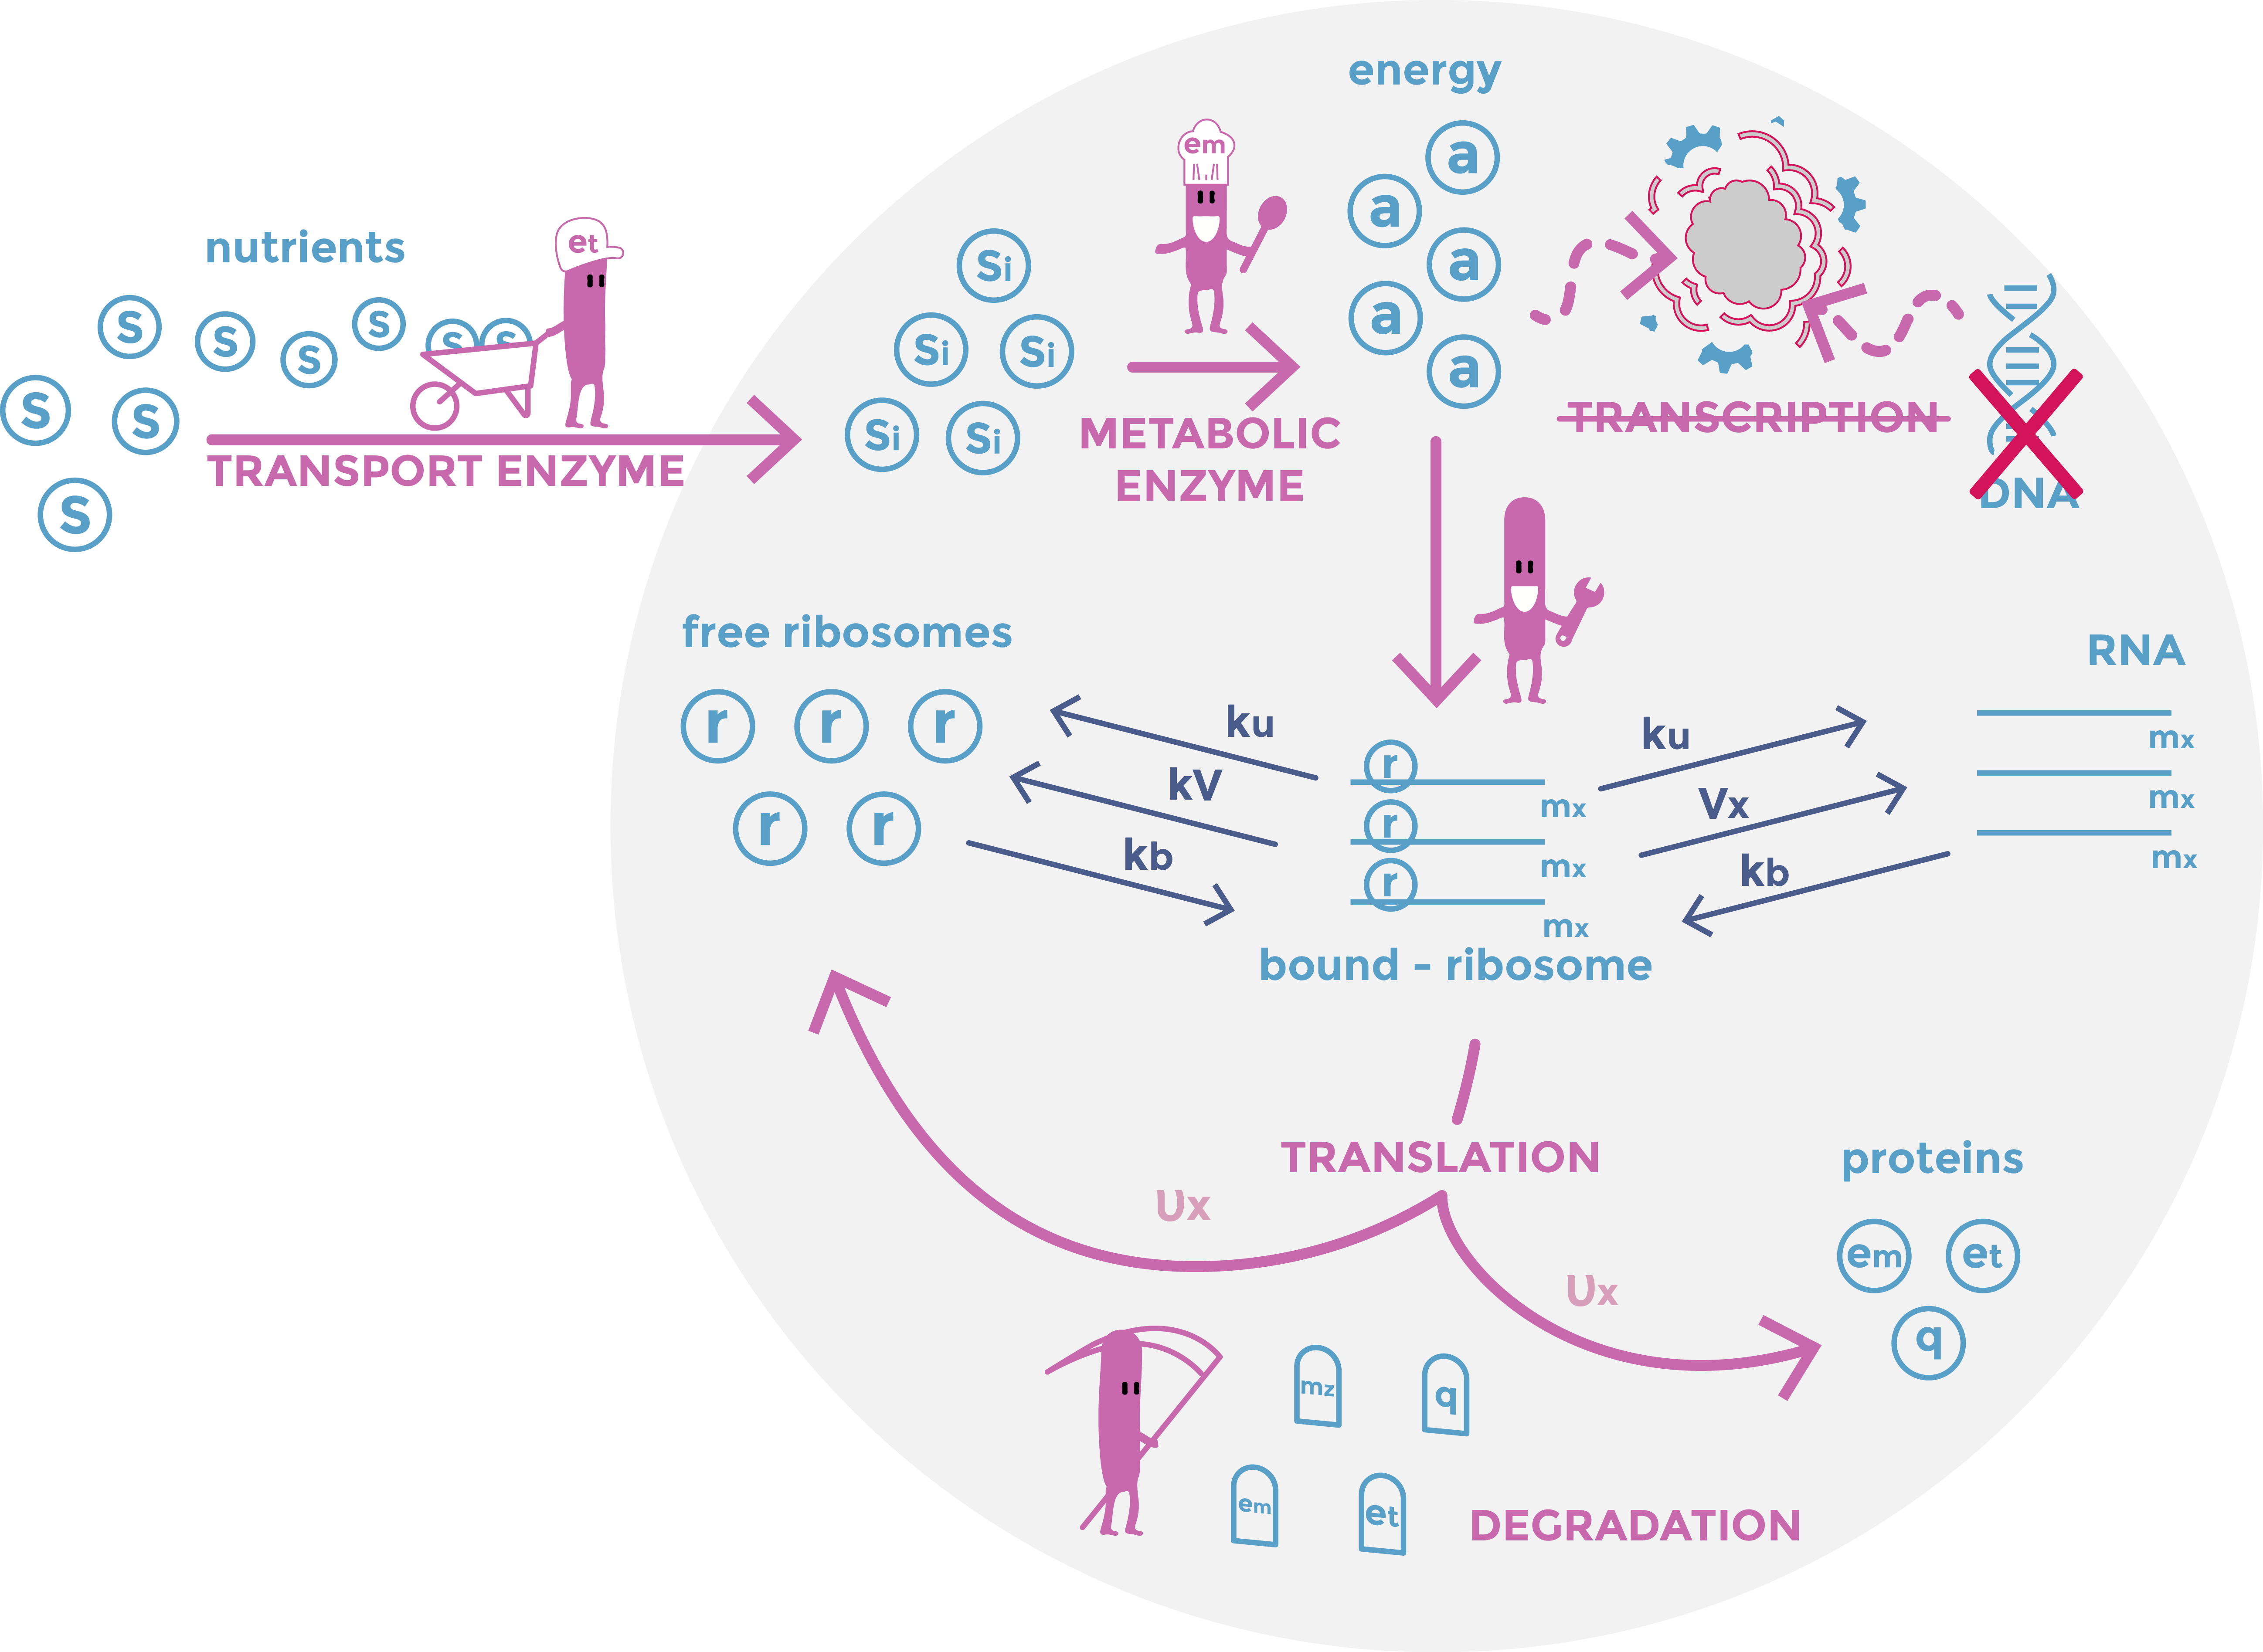
In summary the first part model models different exchanges: The import of nutrients into the bacteria, their transformation into energy by enzymes; The transcription of RNA and its use by ribosomes for the production of proteins; The degradation of proteins and RNAs. As we look at a population of bacteria reduced to a single entity, we do not consider division but rather a term of dilution.
The first part of the model is with some exceptions similar to the model developed in the article based on the model [1] In particular, we have added a term of protein degradation for greater precision in the quantities of proteins, because after cutting the DNA, they become the dominant quantities.
Equation summary:
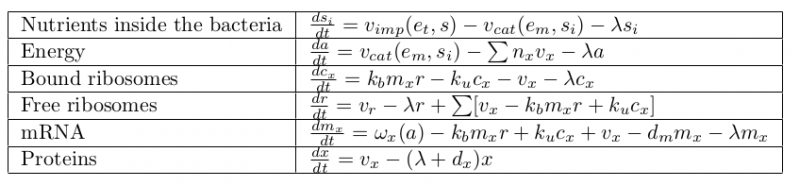
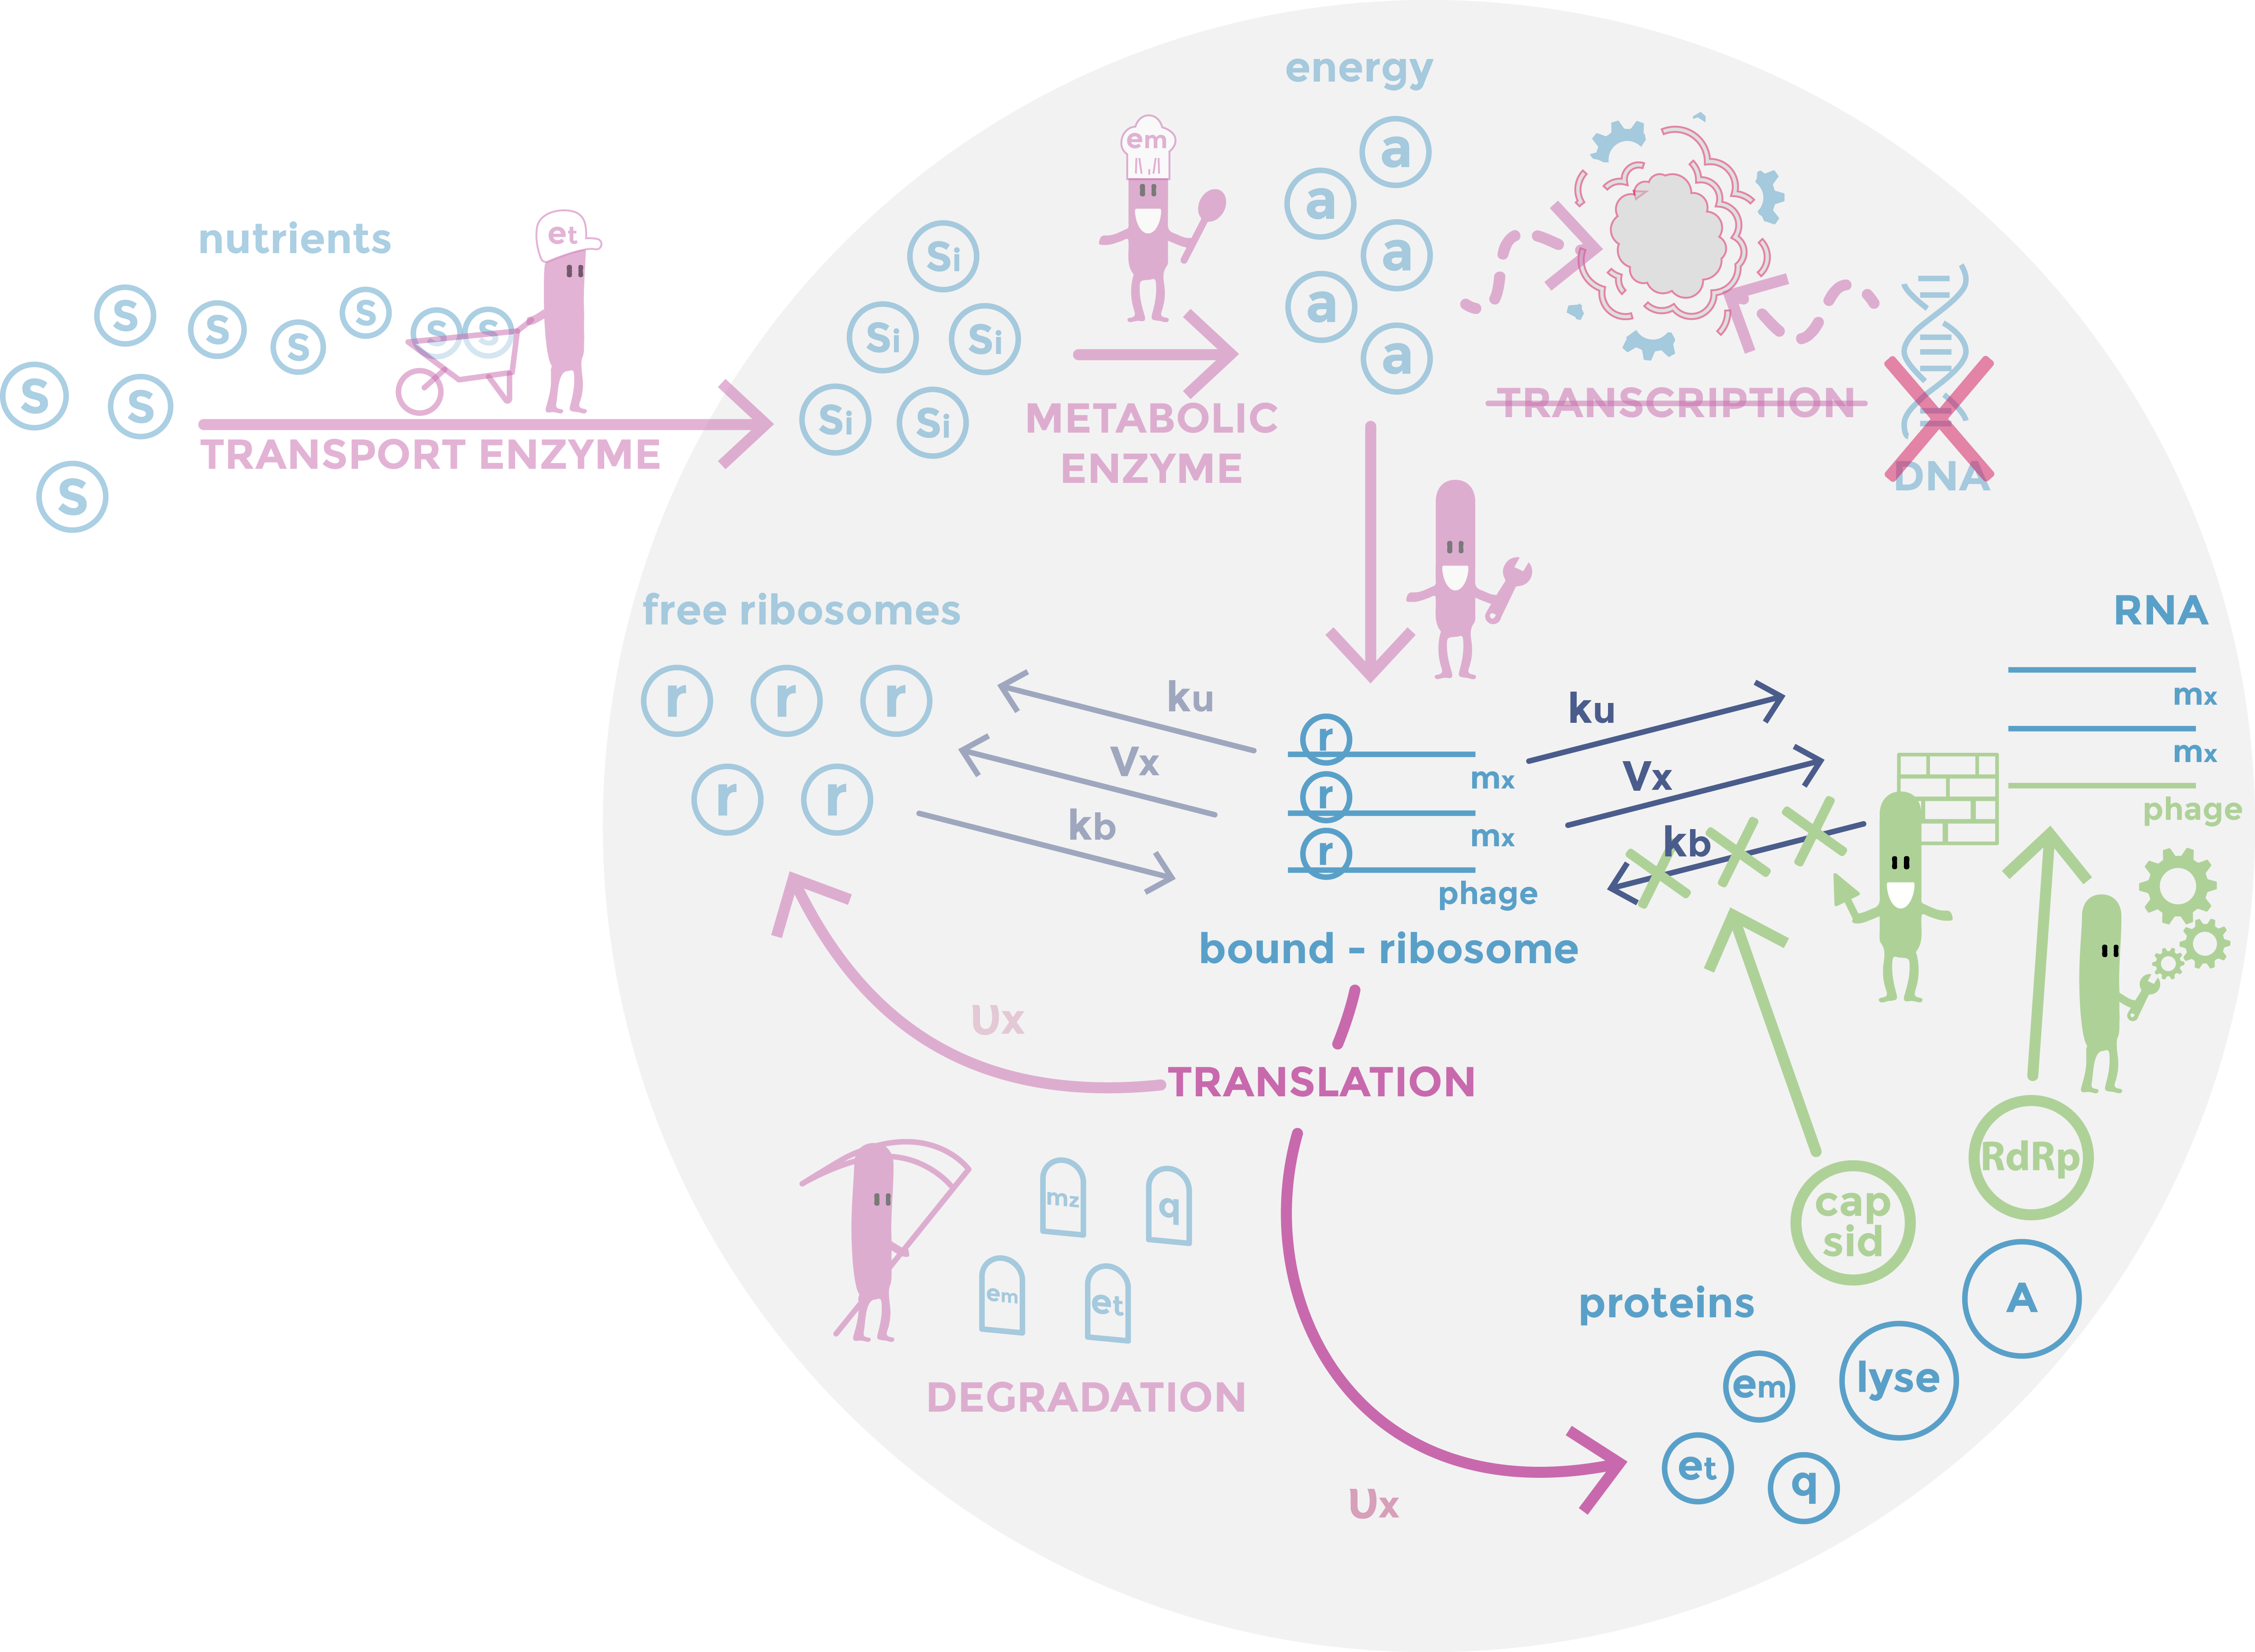
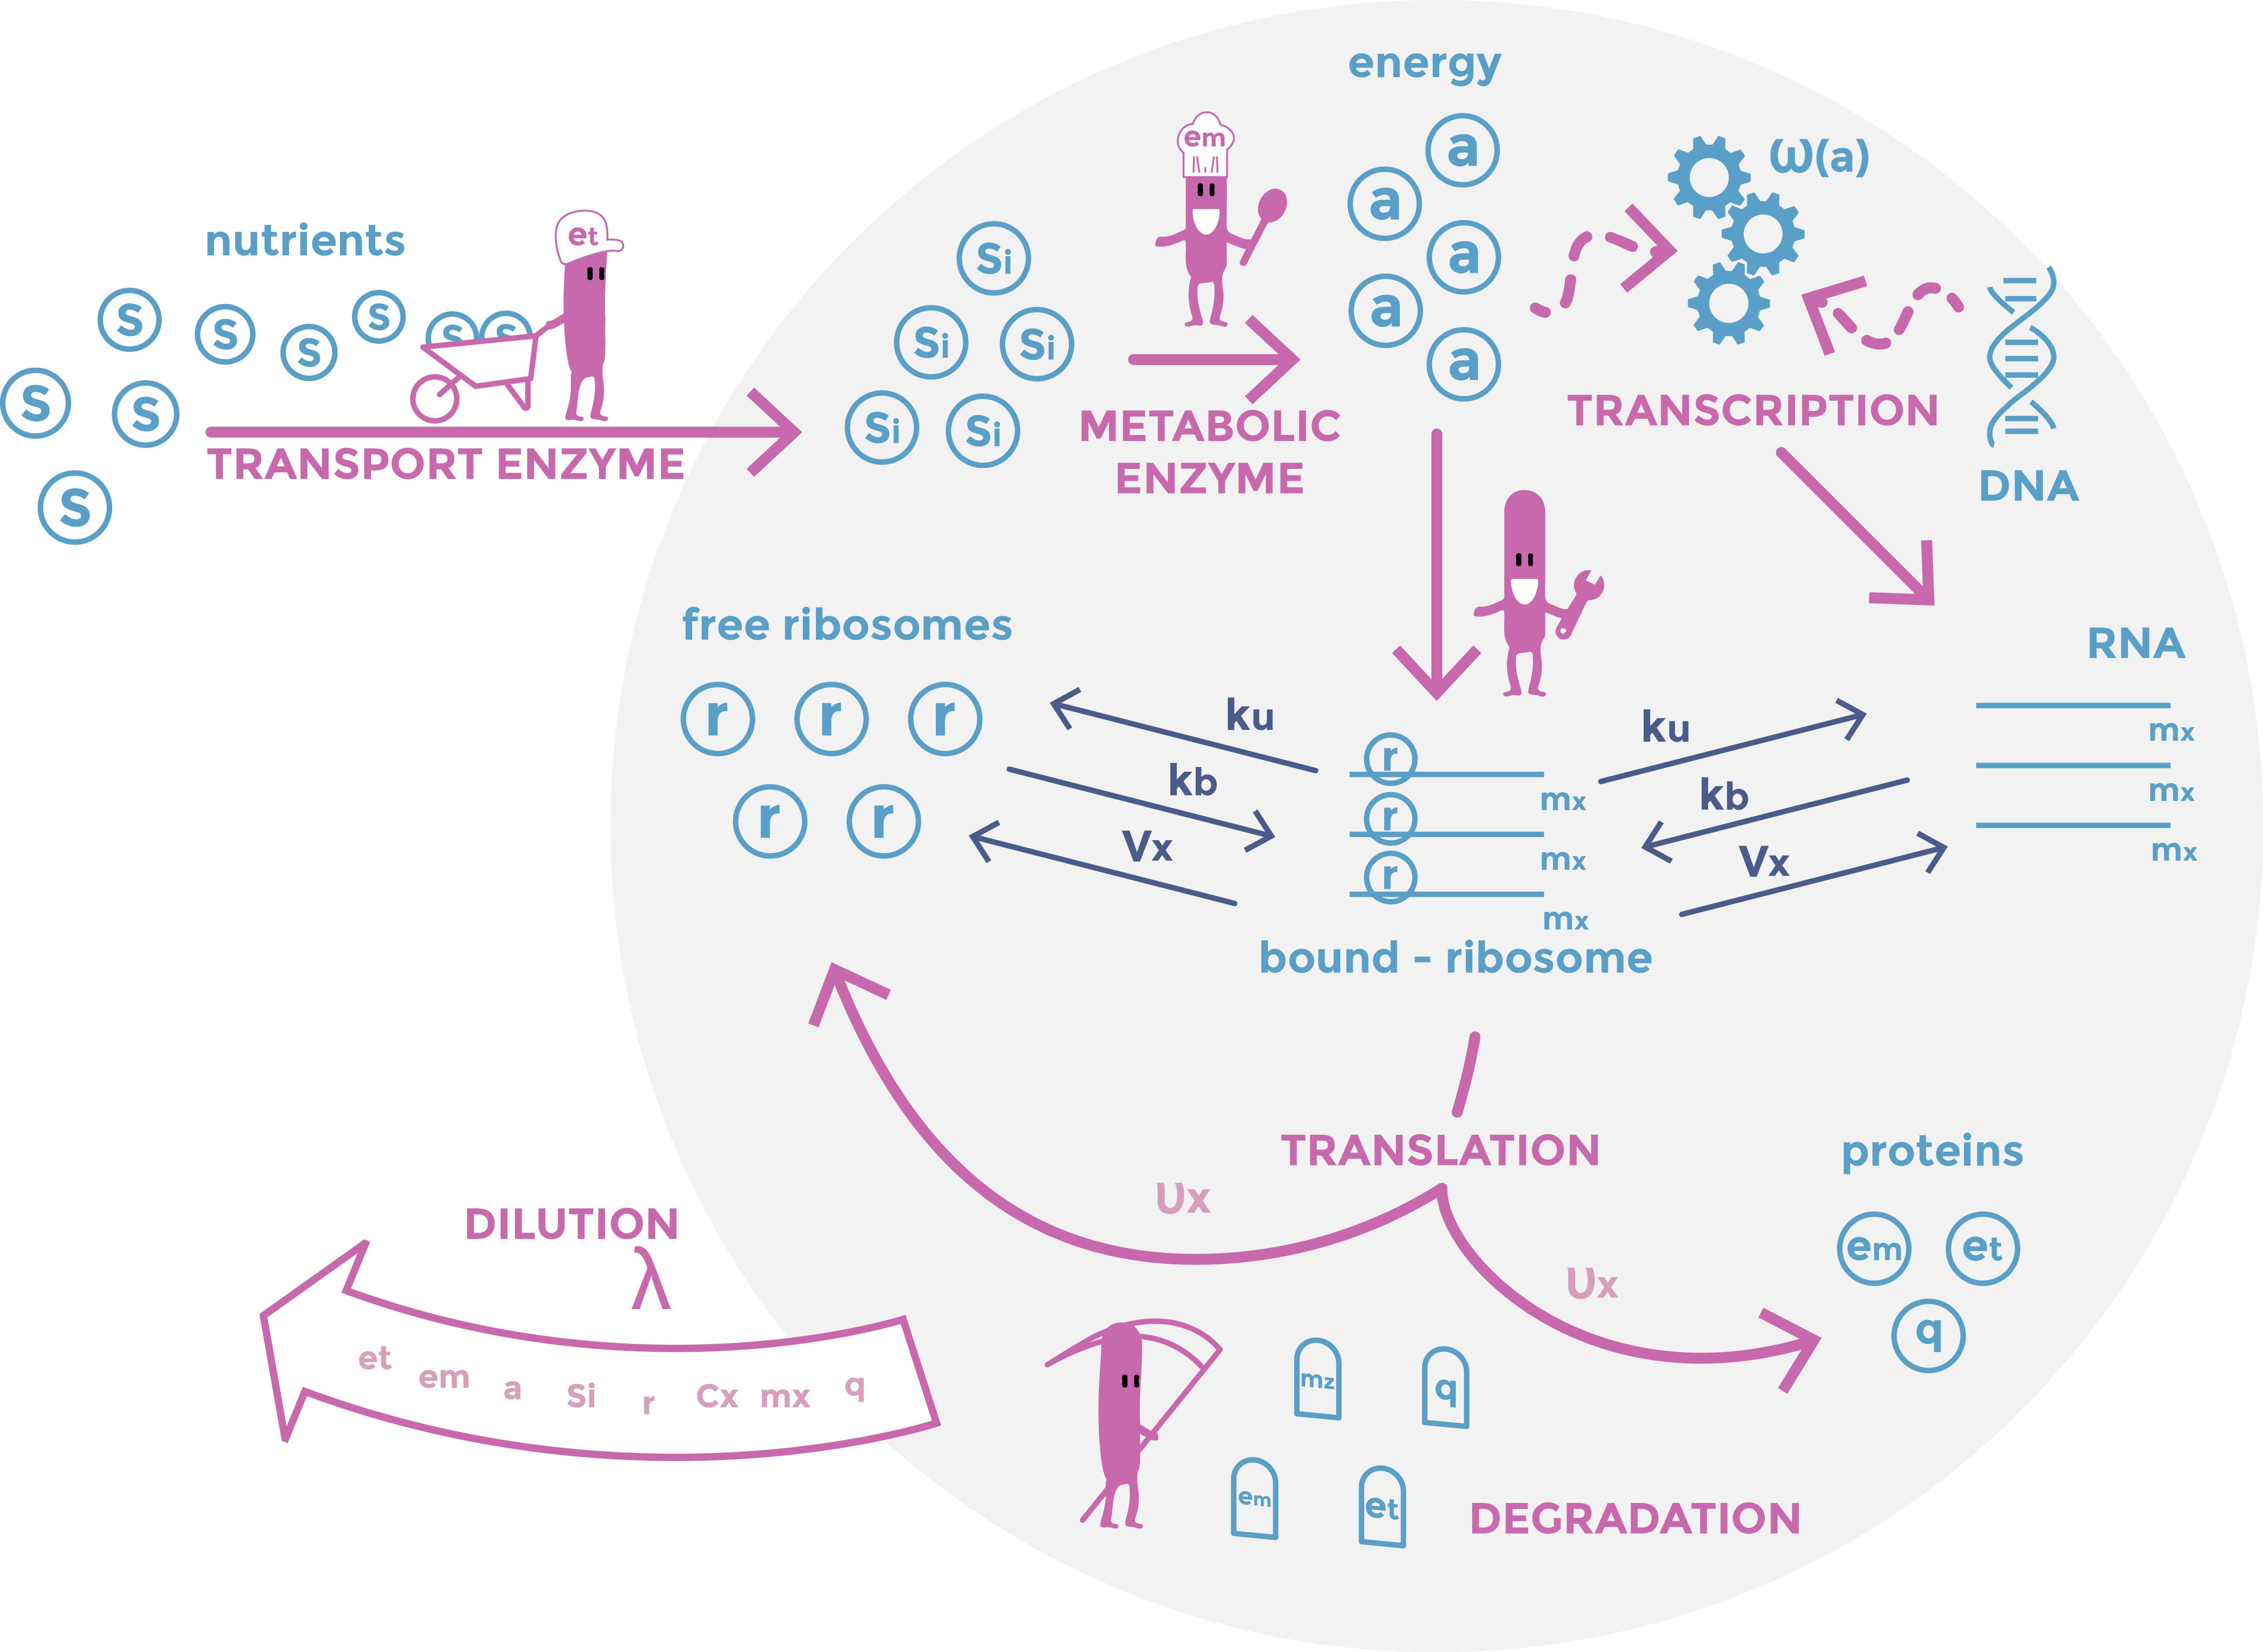 Scheme of the first part of the model. Cellular mechanisms described in the model are in pink, cell constituents are in light blue and constant are in dark blue.
Second part of the model: modelling the effect of nucleases
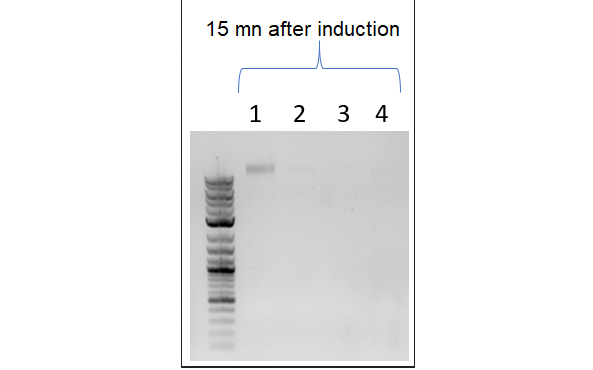 This picture shows a result of gDNA gel electrophoresis obtained by our team. Genomic DNAs were extracted from bacteria E. coli Keio-Z1 F') expressing different nucleases. Lane 1: Keio-Z1 F' pBAD (negative control without nuclease), lane 2: Keio-Z1 F' pBAD-nuclease A1, lane 3: Keio-Z1 F' pBAD-nuclease gp3. We can observe that there is completely removed after 15 min.
We also add this decline to the translation rate of ribosome production because ribosome production depends on ribosomal gene expression (and so on the presence of intact gDNA).
The principal purpose of the model is to evaluate the fate of DNA-less bacteria: how long are they still metabolically active?
As they ca not divide, we decided to set $\lambda$, the dilution term, to zero.
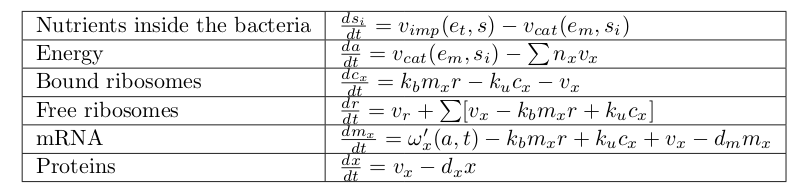
This gives these equations:
This picture shows a result of gDNA gel electrophoresis obtained by our team. Genomic DNAs were extracted from bacteria E. coli Keio-Z1 F') expressing different nucleases. Lane 1: Keio-Z1 F' pBAD (negative control without nuclease), lane 2: Keio-Z1 F' pBAD-nuclease A1, lane 3: Keio-Z1 F' pBAD-nuclease gp3. We can observe that there is completely removed after 15 min.
We also add this decline to the translation rate of ribosome production because ribosome production depends on ribosomal gene expression (and so on the presence of intact gDNA).
The principal purpose of the model is to evaluate the fate of DNA-less bacteria: how long are they still metabolically active?
As they ca not divide, we decided to set $\lambda$, the dilution term, to zero.
This gives these equations:
 Scheme of the second part of the model. In particular, we can see DNA degradation by the nucleases and the cessation of dilution. Cellular mechanisms described in the model are in pink, cell components in light blue and constants in dark blue.
To obtain our results, the first part of the model was run until it stabilized. Thereafter the second part of the model took precedence over the first part of the model.
This allowed us to obtain many remarkable results!
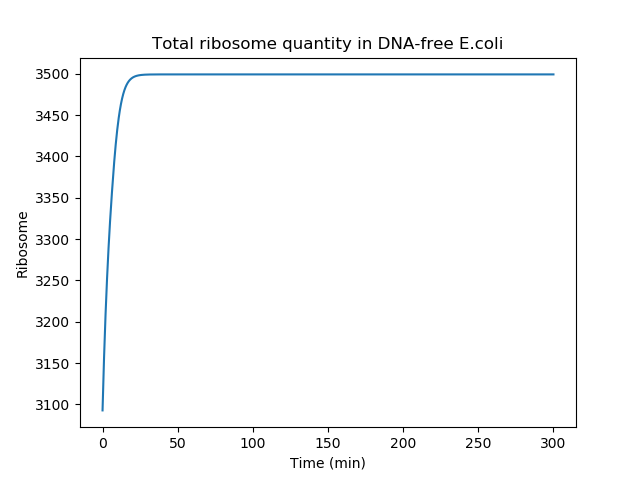
First, we observed that the total amount of ribosomes stop increasing.
Scheme of the second part of the model. In particular, we can see DNA degradation by the nucleases and the cessation of dilution. Cellular mechanisms described in the model are in pink, cell components in light blue and constants in dark blue.
To obtain our results, the first part of the model was run until it stabilized. Thereafter the second part of the model took precedence over the first part of the model.
This allowed us to obtain many remarkable results!
First, we observed that the total amount of ribosomes stop increasing.
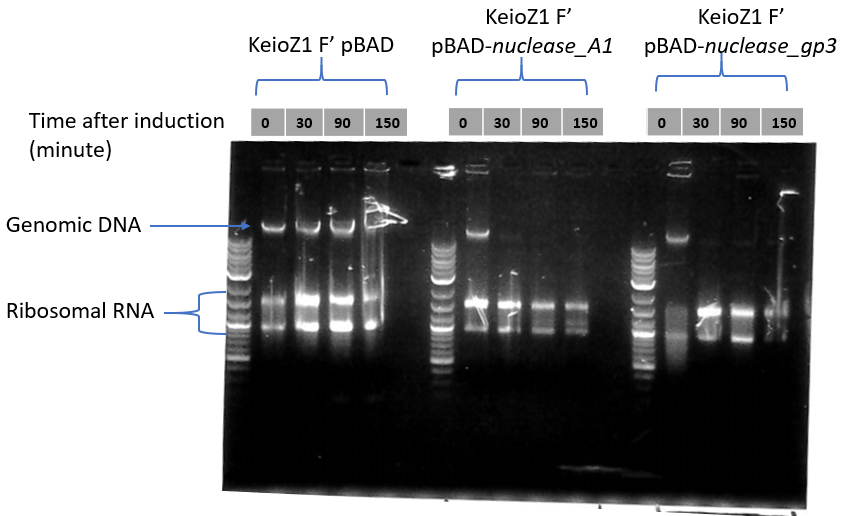
 At the top is presented the analysis of gDNA and rRNA quantities by gel electrophoresis. Nuclease expression was induced at time 0. Our team observed that the quantity of ribosomal RNA decreases only slightly over time.
Below is presented the total ribosome quantity over time after 'nuclease induction' (second part of the model). The ribosome quantity is reaching a plateau after a short period of time because the cell rapidly stop creating new ribosomes, due to gDNA degradation. Of note, in our model, the total ribosome quantity is not decreasing because the ribosome half-life time was neglected to simplify our equation. This approximation is appropriated since the half-life time of ribosomes is on the order of several days [3].
Secondly we compared the quantity of housekeeping proteins in the bacteria with or without DNA. To do so, we considered DNA-proficient bacteria that would not have split (this value was obtained by stopping the bacteria dilution in the first part of the model). We obtained this graph:
At the top is presented the analysis of gDNA and rRNA quantities by gel electrophoresis. Nuclease expression was induced at time 0. Our team observed that the quantity of ribosomal RNA decreases only slightly over time.
Below is presented the total ribosome quantity over time after 'nuclease induction' (second part of the model). The ribosome quantity is reaching a plateau after a short period of time because the cell rapidly stop creating new ribosomes, due to gDNA degradation. Of note, in our model, the total ribosome quantity is not decreasing because the ribosome half-life time was neglected to simplify our equation. This approximation is appropriated since the half-life time of ribosomes is on the order of several days [3].
Secondly we compared the quantity of housekeeping proteins in the bacteria with or without DNA. To do so, we considered DNA-proficient bacteria that would not have split (this value was obtained by stopping the bacteria dilution in the first part of the model). We obtained this graph:
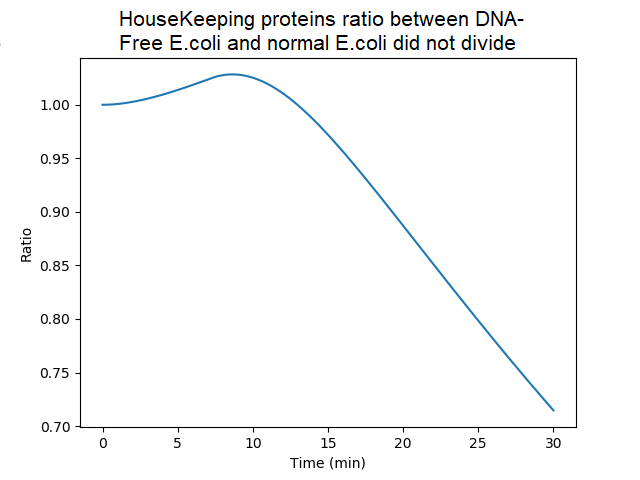 Ratio of the amounts of proteins in bacteria without DNA over bacteria with DNA (factor of dilution neglected). Ratio are quite similar until 20 min since, in DNA-less bacteria, mRNAs bound to ribosomes are initially protected from degradation and still used to produce proteins. However the model assumes that when protein synthesis is achieved, the mRNA is released (and unprotected). Thereafter the ratio decreased because of the absence of newly synthetized mRNA in absence of gDNA.
If cell components are remaining, maybe DNA-less cells can still divide. These aspects were difficult to evalute with our model since bacteria are not considered individually but rather as a whole (biomass). Considering the biomass per se, we can however make some hypothesis based on the assumption that cell division correlates with a critical mass based on the model [4].
This results shows that at some time points, the mass of proteins in cell without DNA is equivalent to cell with DNA. From a pure proteomic point of view, a DNA-free cell can reach the biomass required to induce a division in a DNA-proficient bacteria. This has been experimentally explored by the team. Indeed, videomicroscopy experiments indicated that bacteria that initiated a division before nuclease induction achieved this process (independently of DNA-related signals). However, new division initiation was not observed. A stochastic model (including 'ori' DNA signal) would be needed to explore further this question.
Until 15mn, the DNA-less cell continues to produce proteins at similar level than the healthy DNA-proficient cell. And after 15mn, protein quantity remains rather close of the healthy bacteria (70% at 30mn) . This leads us to hypothesize that DNA-less bacteria would present a significant metabolic activity during a 'window period'. This has been experimentally demonstrated by the team (see the "DNA-free cell and depollution" section).
During the experiments, we observed that DNA-less bacteria were often deformed. We wonder if our mathematical model could give some explanation to this phenotype. We must be cautious with hypothesis since cells expressing the nuclease-A1 do not display this flattening phenotype, suggesting that the phenotype may be multiparametric. Our model predicts an initial increase in protein amount (notably housekeeping proteins, which comprise cytoskeletal proteins) in DNA-less bacteria. Maybe that these cells accumulate proteins, synthesize peptidoglycan and thus elongate [5] but do not initiate a new division in absence of DNA.
This is what we observed when comparing the amount of housekeeping proteins in a DNA-less bacteria to the average amount of housekeeping proteins in a DNA-proficient bacteria.
Ratio of the amounts of proteins in bacteria without DNA over bacteria with DNA (factor of dilution neglected). Ratio are quite similar until 20 min since, in DNA-less bacteria, mRNAs bound to ribosomes are initially protected from degradation and still used to produce proteins. However the model assumes that when protein synthesis is achieved, the mRNA is released (and unprotected). Thereafter the ratio decreased because of the absence of newly synthetized mRNA in absence of gDNA.
If cell components are remaining, maybe DNA-less cells can still divide. These aspects were difficult to evalute with our model since bacteria are not considered individually but rather as a whole (biomass). Considering the biomass per se, we can however make some hypothesis based on the assumption that cell division correlates with a critical mass based on the model [4].
This results shows that at some time points, the mass of proteins in cell without DNA is equivalent to cell with DNA. From a pure proteomic point of view, a DNA-free cell can reach the biomass required to induce a division in a DNA-proficient bacteria. This has been experimentally explored by the team. Indeed, videomicroscopy experiments indicated that bacteria that initiated a division before nuclease induction achieved this process (independently of DNA-related signals). However, new division initiation was not observed. A stochastic model (including 'ori' DNA signal) would be needed to explore further this question.
Until 15mn, the DNA-less cell continues to produce proteins at similar level than the healthy DNA-proficient cell. And after 15mn, protein quantity remains rather close of the healthy bacteria (70% at 30mn) . This leads us to hypothesize that DNA-less bacteria would present a significant metabolic activity during a 'window period'. This has been experimentally demonstrated by the team (see the "DNA-free cell and depollution" section).
During the experiments, we observed that DNA-less bacteria were often deformed. We wonder if our mathematical model could give some explanation to this phenotype. We must be cautious with hypothesis since cells expressing the nuclease-A1 do not display this flattening phenotype, suggesting that the phenotype may be multiparametric. Our model predicts an initial increase in protein amount (notably housekeeping proteins, which comprise cytoskeletal proteins) in DNA-less bacteria. Maybe that these cells accumulate proteins, synthesize peptidoglycan and thus elongate [5] but do not initiate a new division in absence of DNA.
This is what we observed when comparing the amount of housekeeping proteins in a DNA-less bacteria to the average amount of housekeeping proteins in a DNA-proficient bacteria.
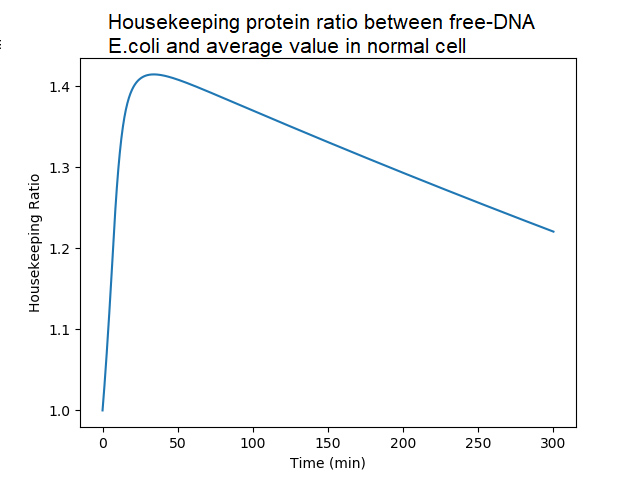 Ratio of housekeeping proteins in DNA-less bacteria to the average value in DNA-proficient bacteria. A DNA-proficient bacteria divides, and so does the quantity of proteins. There is an accumulation of housekeeping proteins in DNA-less cell, almost 150% of the normal value, because they do not divide. After 50mn, the quantity decreases in a DNA-less bacteria because of protein degradation (not compensated by protein synthesis in absence of newly synthetized mRNA).
Third part model: the phage infection
How does the model work ?
One of the main experimental result of our team was the replication of an RNA information within DNA-less bacteria. This was obtained by infecting DNA-free bacteria with the MS2 RNA phage. An intriguing result was the drastic decrease of the number of phages produced by DNA-less bacteria compared to a normal bacteria.
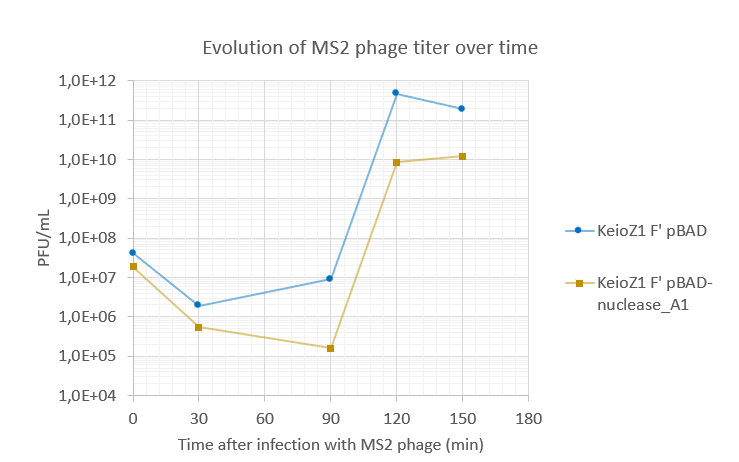 Amount of virions produced by DNA-proficient E.coli (KeioZ1 F' pBAD) and DNA-less E.coli (KeioZ1 F' pBAD nuclease-A1). DNA-less bacteria produced around 10-fold less phages than DNA-proficient bacteria.
For this reason we decided to model phage infection in DNA-less and DNA-proficient bacteria.
To implement the phage model in our initial DNA-less bacteria model, we made few hypothesis that may seem biologically heavy but which, after multiple tests, do not change drastically the nature of the results.
In our model, phage RNA (vRNA, for 'viral RNA') are replicated by the viral RDRP (RNA-dependent-RNA-polymerase) protein which is produced by translation of the vRNA by host ribosomes. The RDRP replicates vRNA into a minus strand, which serves as template to produce new positive strand vRNA genomes.
vRNA encodes 4 proteins: the maturation protein A, CP (capsid/coat protein), L (lysis protein) and the RDRP polymerase. CP proteins bind to a vRNA (positive strand), so that new viral particles are assembled within the cytoplasm. This vRNA packaging into the capsids prevents the ribosomes from binding to vRNA.
First, based on [6], we made the reasonable assumption that duplication is exponential and depends on RDRP enzyme quantity. To simplify the model, we assumed that all RDRP proteins find a free vRNA.
In order to simplify the model, we also assumed that vRNA can be both the template of replication (by RDRP) and of translation (by host ribosomes).
This gives this duplication rate for vRNA:
$$
w_{f}= \frac{rdrp \times G}{N_{f}},
$$
where $rdrp$ is the RDRP quantity already produced, $G$ is the RDRP speed of polymerisation (duplication of RNA) in accordance with this article [6] and $N_{f}$ the nucleotide size of the vRNA.
In order to represent the capsid effect we modify the binding rate of vRNA to the ribosomes as followed:
$$
kb'=kb \times \frac{K_{caps}}{K_{caps}+capside},
$$
where Kcaps is find by optimization based on the result from [7].
Amount of virions produced by DNA-proficient E.coli (KeioZ1 F' pBAD) and DNA-less E.coli (KeioZ1 F' pBAD nuclease-A1). DNA-less bacteria produced around 10-fold less phages than DNA-proficient bacteria.
For this reason we decided to model phage infection in DNA-less and DNA-proficient bacteria.
To implement the phage model in our initial DNA-less bacteria model, we made few hypothesis that may seem biologically heavy but which, after multiple tests, do not change drastically the nature of the results.
In our model, phage RNA (vRNA, for 'viral RNA') are replicated by the viral RDRP (RNA-dependent-RNA-polymerase) protein which is produced by translation of the vRNA by host ribosomes. The RDRP replicates vRNA into a minus strand, which serves as template to produce new positive strand vRNA genomes.
vRNA encodes 4 proteins: the maturation protein A, CP (capsid/coat protein), L (lysis protein) and the RDRP polymerase. CP proteins bind to a vRNA (positive strand), so that new viral particles are assembled within the cytoplasm. This vRNA packaging into the capsids prevents the ribosomes from binding to vRNA.
First, based on [6], we made the reasonable assumption that duplication is exponential and depends on RDRP enzyme quantity. To simplify the model, we assumed that all RDRP proteins find a free vRNA.
In order to simplify the model, we also assumed that vRNA can be both the template of replication (by RDRP) and of translation (by host ribosomes).
This gives this duplication rate for vRNA:
$$
w_{f}= \frac{rdrp \times G}{N_{f}},
$$
where $rdrp$ is the RDRP quantity already produced, $G$ is the RDRP speed of polymerisation (duplication of RNA) in accordance with this article [6] and $N_{f}$ the nucleotide size of the vRNA.
In order to represent the capsid effect we modify the binding rate of vRNA to the ribosomes as followed:
$$
kb'=kb \times \frac{K_{caps}}{K_{caps}+capside},
$$
where Kcaps is find by optimization based on the result from [7].
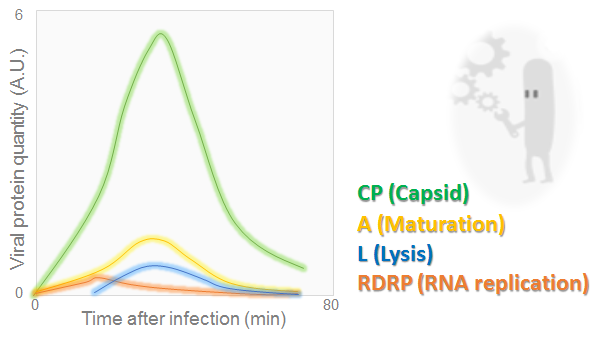 Viral protein amounts during MS2 phage cycle
The graph, adapted from [7], illustrates the evolution of lysis, maturation, RDRP and capsid proteins over the time. It may be seen that all quantities have reached a peak at 30 min. Then they dropped off
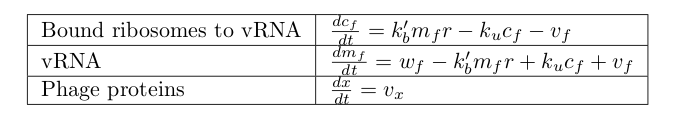
Finally in addition to the original equations modeling DNA-less bacteria physiology, we add these equations to represent the phage infection.
Viral protein amounts during MS2 phage cycle
The graph, adapted from [7], illustrates the evolution of lysis, maturation, RDRP and capsid proteins over the time. It may be seen that all quantities have reached a peak at 30 min. Then they dropped off
Finally in addition to the original equations modeling DNA-less bacteria physiology, we add these equations to represent the phage infection.
 Scheme of the phage part of the model. RDRP are replicating vRNAs and capsid which prevent the ribosomes from binding to vRNAs. Host mechanisms described in the model are in pink, cell components in light blue, constants in dark and specific phages mechanisms in green.
In order to understand why there are less virions produced in DNA-less cell, we compared the production rate of phage proteins in DNA-less and DNA-proficient bacteria. The production rate of proteins directly depends on the quantity of ribosomes bound to vRNA. Therefore we compared the quantities of bound ribosomes in DNA-less and DNA-proficient bacteria.
This gives this result:
Scheme of the phage part of the model. RDRP are replicating vRNAs and capsid which prevent the ribosomes from binding to vRNAs. Host mechanisms described in the model are in pink, cell components in light blue, constants in dark and specific phages mechanisms in green.
In order to understand why there are less virions produced in DNA-less cell, we compared the production rate of phage proteins in DNA-less and DNA-proficient bacteria. The production rate of proteins directly depends on the quantity of ribosomes bound to vRNA. Therefore we compared the quantities of bound ribosomes in DNA-less and DNA-proficient bacteria.
This gives this result:
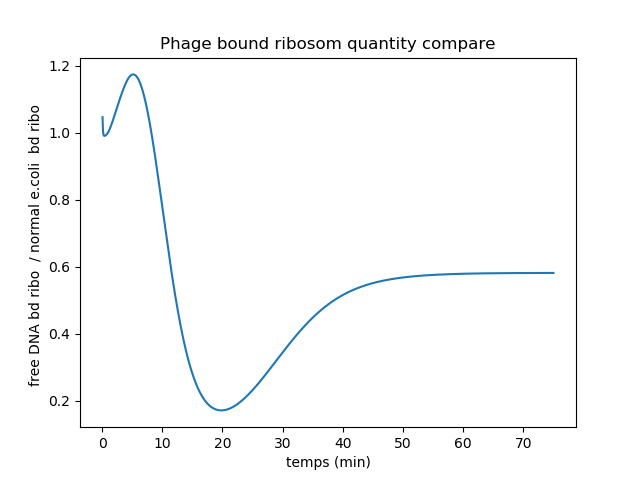 Ratio plot of bound ribosomes quantity in DNA-less and DNA-proficient infected bacteria.
Since the DNA-less bacteria quickly lose host endogenous RNA, there are until 10mn more vRNA bound to ribosomes in these cells. Indeed the competition between vRNAs and host mRNAs for ribosome binding is in favor of vRNA in DNA-less bacteria compared to DNA-proficient bacteria. But later on, the DNA-less bacteria completely stop producing ribosomes. Therefore less ribosomes are available to bind to vRNAs. This can explain the ratio decrease to 0.2. After 20mn, the ratio increases again to reach 0.6. This may be due to the fact that the ribosomes that were translating the host mRNAs detached from them and started translating vRNAs.
Bound ribosomes ratio is quasi-equivalent to proteins production rate ratio. Therefore we can conclude that average production rate for phage proteins is higher on the bacteria with than without gDNA.
This allows us to hypothesize that the lower phage production in DNA-less bacteria is due to a lower quantity of host ribosomes. This effect may be particularly important since, in reality, RDRP assembles with host proteins (ribosomal S1 protein, translation elongation factors EF-Tu and EF-Ts) to form the active viral polymerase. We did not include this molecular mechanism in our model, but we assume that it can accentuate the importance of the reserve of ribosomes available on the level of phage production.
Last remark: many thanks to Vincent Danos (ENS Ulm, Paris) and Guillaume Terradot (Edinburgh), specialists in the bacterial growth model [1] we initially used. Thank you for taking the time to discuss with us the adaptation of this model to the particular case of DNA-free cells. This discussion was very stimulating!
Ratio plot of bound ribosomes quantity in DNA-less and DNA-proficient infected bacteria.
Since the DNA-less bacteria quickly lose host endogenous RNA, there are until 10mn more vRNA bound to ribosomes in these cells. Indeed the competition between vRNAs and host mRNAs for ribosome binding is in favor of vRNA in DNA-less bacteria compared to DNA-proficient bacteria. But later on, the DNA-less bacteria completely stop producing ribosomes. Therefore less ribosomes are available to bind to vRNAs. This can explain the ratio decrease to 0.2. After 20mn, the ratio increases again to reach 0.6. This may be due to the fact that the ribosomes that were translating the host mRNAs detached from them and started translating vRNAs.
Bound ribosomes ratio is quasi-equivalent to proteins production rate ratio. Therefore we can conclude that average production rate for phage proteins is higher on the bacteria with than without gDNA.
This allows us to hypothesize that the lower phage production in DNA-less bacteria is due to a lower quantity of host ribosomes. This effect may be particularly important since, in reality, RDRP assembles with host proteins (ribosomal S1 protein, translation elongation factors EF-Tu and EF-Ts) to form the active viral polymerase. We did not include this molecular mechanism in our model, but we assume that it can accentuate the importance of the reserve of ribosomes available on the level of phage production.
Last remark: many thanks to Vincent Danos (ENS Ulm, Paris) and Guillaume Terradot (Edinburgh), specialists in the bacterial growth model [1] we initially used. Thank you for taking the time to discuss with us the adaptation of this model to the particular case of DNA-free cells. This discussion was very stimulating!
[1] A.Weiße and al., "Mechanistic links between cellular trade-offs, gene expression, and growth", PNAS, 2015. [2] MA.Moran and al., "Sizing up metatranscriptomics" ISME J. 2012. [3] E.Nikolov and al.,« Turnover of Ribosomes in Regenerating Rat Liver ». International Journal of Biochemistry, 1983. [4] M.Scott et al.,"Interdependence of Cell Growth and Gene Expression: Origins and Consequences", Science, 2010. [5] T.Uehara and al., "Growth of Escherichia coli: Significance of Peptidoglycan Degradation during Elongation and Septation", Journal of bacteriology, 2008. [6] K.Hosoda and al., "Kinetic Analysis of the Entire RNA Amplification Process by that Qbeta", Journal of Biological Chemistry, 2007. [7] M.Beremand and al., "Overlapping genes in RNA phage: a new protein implicated in lysis", Cell, 1979
