Difference between revisions of "Team:Mingdao/Model"
| (17 intermediate revisions by the same user not shown) | |||
| Line 9: | Line 9: | ||
}); | }); | ||
</script> | </script> | ||
| − | <script src="https://2019.igem.org/common/MathJax-2.5-latest/MathJax.js?config=TeX-AMS-MML_HTMLorMML"> | + | <script src="https://2019.igem.org/common/MathJax-2.5-latest/MathJax.js?config=TeX-AMS-MML_HTMLorMML"></script> |
</head> | </head> | ||
| Line 29: | Line 29: | ||
color: #ff9900!important; | color: #ff9900!important; | ||
font-size: 40px!important; | font-size: 40px!important; | ||
| + | } | ||
| + | .row li{ | ||
| + | line-height: 1.4!important; | ||
| + | color: #484848!important; | ||
| + | } | ||
| + | p { | ||
| + | line-height: 1.4!important; | ||
| + | font-size: 20px!important; | ||
} | } | ||
</style> | </style> | ||
| Line 92: | Line 100: | ||
<div class="pathWord path-word-sm"> | <div class="pathWord path-word-sm"> | ||
<p>Final Model</p> | <p>Final Model</p> | ||
| + | </div> | ||
| + | </div> | ||
| + | |||
| + | <div class="path"> | ||
| + | <div class="pathSvg"> | ||
| + | <svg width="80" height="100"> | ||
| + | <rect x="36" y="20" width="6" height="80" style="fill:#385e66"></rect> | ||
| + | </svg> | ||
| + | </div> | ||
| + | <div id="soft-s-btn" class="path-dot" style="top: 400px; background-color: rgb(255, 255, 255);"></div> | ||
| + | <div class="pathWord path-word-sm"> | ||
| + | <p>Our Software</p> | ||
| + | </div> | ||
| + | </div> | ||
| + | |||
| + | <div class="path"> | ||
| + | <div class="pathSvg"> | ||
| + | <svg width="80" height="100"> | ||
| + | <rect x="36" y="20" width="6" height="80" style="fill:#385e66"></rect> | ||
| + | </svg> | ||
| + | </div> | ||
| + | <div id="conc-s-btn" class="path-dot" style="top: 500px; background-color: rgb(255, 255, 255);"></div> | ||
| + | <div class="pathWord path-word-sm"> | ||
| + | <p>Conclusion</p> | ||
</div> | </div> | ||
</div> | </div> | ||
| Line 100: | Line 132: | ||
</svg> | </svg> | ||
</div> | </div> | ||
| − | <div id="manage-t-btn" class="path-dot" style="top: | + | <div id="manage-t-btn" class="path-dot" style="top: 600px; background-color: rgb(255, 255, 255);"></div> |
<div class="pathWord path-word-sm"> | <div class="pathWord path-word-sm"> | ||
<p>References</p> | <p>References</p> | ||
| Line 176: | Line 208: | ||
<p>Exhalation rate is the amount of air that an individual exhales per unit time. From literature, the exhalation rate of an individual is shown below (Jung). The default value used in our model is calculated by the average of minimum and maximum values. Unit conversions are shown below.</p> | <p>Exhalation rate is the amount of air that an individual exhales per unit time. From literature, the exhalation rate of an individual is shown below (Jung). The default value used in our model is calculated by the average of minimum and maximum values. Unit conversions are shown below.</p> | ||
<center><img src="https://static.igem.org/mediawiki/2019/e/e3/T--Mingdao--table11.png" alt="" style="max-width:700px;"> | <center><img src="https://static.igem.org/mediawiki/2019/e/e3/T--Mingdao--table11.png" alt="" style="max-width:700px;"> | ||
| − | + | <p style="margin-left:29%;"><strong>Table 1. </strong>Exhalation rate of an individual with unit conversion (Jung)</p> | |
<img src="https://static.igem.org/mediawiki/2019/0/0b/T--Mingdao--equa13.png" alt="" style="max-width:600px;"></center> | <img src="https://static.igem.org/mediawiki/2019/0/0b/T--Mingdao--equa13.png" alt="" style="max-width:600px;"></center> | ||
| Line 183: | Line 215: | ||
<center><img src="https://static.igem.org/mediawiki/2019/0/06/T--Mingdao--modre.png" alt="" style="max-width:700px;"> | <center><img src="https://static.igem.org/mediawiki/2019/0/06/T--Mingdao--modre.png" alt="" style="max-width:700px;"> | ||
| − | + | <p style="margin-left:29%;"><b>Table 2. </b>CO2 concentration in exhalation with unit conversion (Jung)</p> | |
<img src="https://static.igem.org/mediawiki/2019/0/08/T--Mingdao--equa14.png" alt="" style="max-width:700px;"></center> | <img src="https://static.igem.org/mediawiki/2019/0/08/T--Mingdao--equa14.png" alt="" style="max-width:700px;"></center> | ||
<h3>Factor 1: Discussion</h3> | <h3>Factor 1: Discussion</h3> | ||
| − | The total amount of CO2 produced by an individual per unit time can be calculated by multiplying the exhalation rate of an individual (factor 1b, obtained from literature) with the CO2 concentration in exhalation (factor 1c, obtained from literature). The derived value can then be multiplied by the number of people and divided by the volume of the room to compute for the instantaneous rate of CO2 production by human exhalation (Equation 2). The equation in this factor governs the effect of human exhalation on indoor CO2 concentration. | + | <p>The total amount of CO2 produced by an individual per unit time can be calculated by multiplying the exhalation rate of an individual (factor 1b, obtained from literature) with the CO2 concentration in exhalation (factor 1c, obtained from literature). The derived value can then be multiplied by the number of people and divided by the volume of the room to compute for the instantaneous rate of CO2 production by human exhalation (Equation 2). The equation in this factor governs the effect of human exhalation on indoor CO2 concentration. |
| + | </p> | ||
<h1 id ="d-goal">Factor 2: Modeling the Factors that Reduce Carbon Dioxide</h1> | <h1 id ="d-goal">Factor 2: Modeling the Factors that Reduce Carbon Dioxide</h1> | ||
| Line 197: | Line 230: | ||
<h3>Factor 2a: Determining the Natural Dissolution Rate of CO2 in Water</h3> | <h3>Factor 2a: Determining the Natural Dissolution Rate of CO2 in Water</h3> | ||
| − | <p>The natural dissolution rate of CO2 in water (v<sub>natural</sub>) is calculated using the first-order rate constant equation, as shown in Equation 3, where 0.039 s<sup>-1</sup> is the rate constant for the forward reaction of the hydration of carbon dioxide ( | + | <p>The natural dissolution rate of CO2 in water (v<sub>natural</sub>) is calculated using the first-order rate constant equation, as shown in Equation 3, where 0.039 s<sup>-1</sup> is the rate constant for the forward reaction of the hydration of carbon dioxide ($ CO_2 + H_2O\rightarrow H_2CO_3 $). The correlation between the concentration of gaseous carbon dioxide and the natural dissolution rate is illustrated in Figure 1. |
</p> | </p> | ||
<center><div class="card" style="width:550px"> | <center><div class="card" style="width:550px"> | ||
| Line 229: | Line 262: | ||
</div> | </div> | ||
</center> | </center> | ||
| − | <p>Therefore, by inserting the v<sub>max</sub> and K<sub>m</sub> values into the model, the correlation between CO2 concentration and the reaction rate of CA can be shown. v<sub>max</sub> can be calculated with Equation 5. < | + | <p>Therefore, by inserting the v<sub>max</sub> and K<sub>m</sub> values into the model, the correlation between CO2 concentration and the reaction rate of CA can be shown. v<sub>max</sub> can be calculated with Equation 5. </p> |
| − | We obtained the K<sub>cat</sub> and K<sub>m</sub> values for the human carbonic anhydrase II (hCAII) from literature. According to Silverman et al., the K<sub>cat</sub> and K<sub>m</sub> values for hCAII are 1.4×10<sup>6</sup> s<sup>-1</sup> and 9.3×10<sup>-3</sup> M, respectively. A [CA] value of 2.883×10<sup>-3</sup> M is used based on the enzyme we use. Unit conversions are shown below. | + | <p>We obtained the K<sub>cat</sub> and K<sub>m</sub> values for the human carbonic anhydrase II (hCAII) from literature. According to Silverman et al., the K<sub>cat</sub> and K<sub>m</sub> values for hCAII are 1.4×10<sup>6</sup> s<sup>-1</sup> and 9.3×10<sup>-3</sup> M, respectively. A [CA] value of 2.883×10<sup>-3</sup> M is used based on the enzyme we use. Unit conversions are shown below. |
</p> | </p> | ||
<center><img src="https://static.igem.org/mediawiki/2019/b/b1/T--Mingdao--equa18.png" alt="" style="max-width:800px;"></center> | <center><img src="https://static.igem.org/mediawiki/2019/b/b1/T--Mingdao--equa18.png" alt="" style="max-width:800px;"></center> | ||
| − | <p>Using the enzymatic coefficients for the Michaelis-Menten model, we plotted the curve in Figure 2 to model the enzyme kinetics of human carbonic anhydrase II. </p> | + | <p>Using the enzymatic coefficients for the Michaelis-Menten model, we plotted the curve in Figure 2 to model the enzyme kinetics of <i>human carbonic anhydrase II</i>. </p> |
<center><img src="https://static.igem.org/mediawiki/2019/9/9d/T--Mingdao--modelfig2.png" alt="" style="max-width:600px;"></center> | <center><img src="https://static.igem.org/mediawiki/2019/9/9d/T--Mingdao--modelfig2.png" alt="" style="max-width:600px;"></center> | ||
| − | <p style="margin-left:12%;">< | + | <p style="margin-left:12%;"><b>Figure 2. </b>The Michaelis-Menten curve modeling the enzyme activities of hCAII at various concentrations of carbon dioxide. </p> |
| + | <p>The curve above reveals a hyperbolic relationship between the concentration of gaseous carbon dioxide and its dissolution rate, with a greater dissolution rate compared with the natural dissolution rate. This verifies the feasibility of using carbonic anhydrase to increase the dissolution rate of carbon dioxide in our project design. | ||
| + | </p> | ||
<h3>Factor 2c: Determining the Photosynthetic Rate of Cyanobacteria in the Form of CO2 Consumption</h3> | <h3>Factor 2c: Determining the Photosynthetic Rate of Cyanobacteria in the Form of CO2 Consumption</h3> | ||
| − | <p>After carbon dioxide has fully hydrated and dissolved | + | <p>After carbon dioxide has fully hydrated and dissolved in water, the last phase in our process of CO2 sequestration is its removal by the photosynthesis of cyanobacteria <i>Synechococcus elongatus PCC7942</i>. The rate at which the dissolved CO2 is consumed by our cyanobacteria can be modeled with Equation 5, which models the relationship between the concentration of dissolved inorganic carbon (DIC) and the rate of carbon-specific growth (Cμ; which is also equivalent to the rate of photosynthesis v<sub>photosynthesis</sub>), which is represented in the form of O2 production (Clark). The conversion from the amount of O2 production to CO2 sequestration is then performed using the 1:1 molar ratio between O2 and CO2 obtained from the chemical equation of photosynthesis. The maximum rate of growth μ<sub>max</sub> and the half-saturation constant for C<sub>μ</sub>, K<sub>G(DIC)</sub>, specific for the cyanobacteria Synechococcus are consulted from literature. Calculations for the final function are shown below with the parameters listed in Table 3. |
</p> | </p> | ||
| Line 250: | Line 285: | ||
<center><img src="https://static.igem.org/mediawiki/2019/6/61/T--Mingdao--modelfig3.png" alt="" style="max-width:800px;"> | <center><img src="https://static.igem.org/mediawiki/2019/6/61/T--Mingdao--modelfig3.png" alt="" style="max-width:800px;"> | ||
| − | + | <p style="margin-left:35%;"><strong>Table 3. </strong>Parameters used in the calculation for C<sub>μ</sub></p> | |
<img src="https://static.igem.org/mediawiki/2019/c/c3/T--Mingdao--equa20.png" alt="" style="max-width:800px;"></center> | <img src="https://static.igem.org/mediawiki/2019/c/c3/T--Mingdao--equa20.png" alt="" style="max-width:800px;"></center> | ||
| − | <p>Using the converted photosynthetic coefficients that we obtained through literature for our cyanobacteria Synechococcus elongatus, we constructed a graph in Figure 3 showing the relationship between the concentration of dissolved inorganic carbon in water and the rate of CO2 consumption due to photosynthesis.</p> | + | <p>Using the converted photosynthetic coefficients that we obtained through literature for our cyanobacteria <i>Synechococcus elongatus</i>, we constructed a graph in Figure 3 showing the relationship between the concentration of dissolved inorganic carbon in water and the rate of CO2 consumption due to photosynthesis.</p> |
<center><img src="https://static.igem.org/mediawiki/2019/e/e6/T--Mingdao--modelfig4.png" alt="" style="max-width:600px;"> | <center><img src="https://static.igem.org/mediawiki/2019/e/e6/T--Mingdao--modelfig4.png" alt="" style="max-width:600px;"> | ||
| − | <center><p class="text-centered" style="margin-left:15%; margin-right:15%;"><strong>Figure 3. </strong>The Michaelis-Menten curve modeling the photosynthetic activity of Synechococcus elongatus. The CO2 consumption rate at various concentrations of dissolved inorganic carbon (DIC) is shown.</p></center> | + | <center><p class="text-centered" style="margin-left:15%; margin-right:15%;"><strong>Figure 3. </strong>The Michaelis-Menten curve modeling the photosynthetic activity of <i>Synechococcus elongatus</i>. The CO2 consumption rate at various concentrations of dissolved inorganic carbon (DIC) is shown.</p></center> |
</center> | </center> | ||
| + | <p>This model exhibits a hyperbolic relationship, peaking the CO2 consumption rate with 0.6865 μmol/s at approximately 400 μM, after which the maximum productivity is reached and can no longer increase further. | ||
| + | </p> | ||
| − | <h3>Factor 2d: Determining the Solubility of CO2 in Alkaline | + | <h3>Factor 2d: Determining the Solubility of CO2 in Alkaline Environments</h3> |
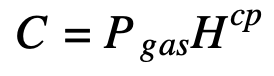
<p>In order to model the maximum dissolvable amount of carbon dioxide in alkaline environments, we first used the Henry's Law (Equation 7), which states that the concentration (C) of a gas in liquid is equal to its partial pressure (P<sub>gas</sub>) multiplied by the Henry's law solubility constant (H<sup>cp</sup>). | <p>In order to model the maximum dissolvable amount of carbon dioxide in alkaline environments, we first used the Henry's Law (Equation 7), which states that the concentration (C) of a gas in liquid is equal to its partial pressure (P<sub>gas</sub>) multiplied by the Henry's law solubility constant (H<sup>cp</sup>). | ||
</p> | </p> | ||
<center><div class="card mt-3 mb-3" style="width:500px"> | <center><div class="card mt-3 mb-3" style="width:500px"> | ||
| − | <img class="card-img-top" src="" alt="Card image"> | + | <img class="card-img-top" src="https://static.igem.org/mediawiki/2019/2/2f/T--Mingdao--Model-Equ7.png" alt="Card image"> |
<div class="card-body"> | <div class="card-body"> | ||
| − | <p class="card-text">< | + | <p class="card-text"><b>Equation 7. </b>Henry's Law, modeling the relationship between the partial pressure of gas and its concentration in a solvent. |
</p> | </p> | ||
</div> | </div> | ||
| Line 271: | Line 308: | ||
<p>From Sander (2015), the Henry's law constant (H<sup>cp</sup>) of carbon dioxide at 25 °C with water as a solvent is 3.3 ⨉ 10<sup>-4</sup> mol·m<sup>-3</sup>·Pa<sup>-1</sup>. Unit conversion is shown below. | <p>From Sander (2015), the Henry's law constant (H<sup>cp</sup>) of carbon dioxide at 25 °C with water as a solvent is 3.3 ⨉ 10<sup>-4</sup> mol·m<sup>-3</sup>·Pa<sup>-1</sup>. Unit conversion is shown below. | ||
</p> | </p> | ||
| − | <center><img src="" alt="" style="max-width:800px;"></center> | + | <center><img src="https://static.igem.org/mediawiki/2019/6/62/T--Mingdao--241.png" alt="" style="max-width:800px;"></center> |
<p>Assuming the concentration of CO2 in air is 400 ppm and the air pressure is 1 atm, the concentration of CO2 in water can be calculated as the following: | <p>Assuming the concentration of CO2 in air is 400 ppm and the air pressure is 1 atm, the concentration of CO2 in water can be calculated as the following: | ||
</p> | </p> | ||
| − | <center><img src="" alt="" style="max-width:800px;"></center> | + | <center><img src="https://static.igem.org/mediawiki/2019/f/fe/T--Mingdao--242.png" alt="" style="max-width:800px;"></center> |
| − | <p>With the rates of the | + | <p>With the rates of the dissolution of CO2 identified both with or without the addition of CA, it is crucial to note that an enzyme does not increase the final yield of products, but instead accelerates its reaction rate. Therefore, it is critical to identify the maximum attainable concentration in water. It is also essential to note that the solvent we use in our project is a culture medium for <i>Synechococcus elongatus</i> and is alkaline with a pH value of 11. The effect of pH on solubility is summarized by the following equation, with the maximum concentration from Henry’s Law considered as [CO<sub>2 (aq)</sub>]: |
</p> | </p> | ||
<center><div class="card mt-3 mb-3" style="width:500px"> | <center><div class="card mt-3 mb-3" style="width:500px"> | ||
| − | <img class="card-img-top" src="" alt="Card image"> | + | <img class="card-img-top" src="https://static.igem.org/mediawiki/2019/a/a1/T--Mingdao--Model--equ8.png" alt="Card image"> |
<div class="card-body"> | <div class="card-body"> | ||
| − | <p class="card-text">< | + | <p class="card-text"><b>Equation 8. </b>An extension of the Henry’s Law that determines the maximum solubility of carbon dioxide in water considering the acidity of the reaction environment. |
| + | </p> | ||
| + | </div> | ||
| + | </div> | ||
| + | </center> | ||
| + | |||
| + | <center><img src="https://static.igem.org/mediawiki/2019/a/a3/T--Mingdao--Model--tab4.png" alt="" style="max-width:700px;"> | ||
| + | <p class="text-centered" style="margin-left:15%; margin-right:15%;"><b>Table 4. </b>Parameters used in the calculation for the maximum attainable concentration of carbon dioxide in water C<sub>max</sub> in alkaline environments. </p> | ||
| + | <p>Therefore the calculation shows:</p></center> | ||
| + | |||
| + | <center><img src="https://static.igem.org/mediawiki/2019/b/b1/T--Mingdao--243.png" alt="" style="max-width:800px;"></center> | ||
| + | |||
| + | <p>The calculation from Equation 8 reveals that at 1 atm, 25 °C in a pH11 solution, the maximum dissolvable amount of carbon dioxide is 3.34⨉10<sup>6</sup> μM. Once the maximum capacity is reached, carbon dioxide can no longer dissolve in the solution, regardless of whether or not enzymes are utilized. | ||
| + | </p> | ||
| + | |||
| + | <h3>Factor 2: Discussion</h3> | ||
| + | <p>From the calculations above, we adopted the first-order rate constant equation and the Michaelis-Menten model to determine the dissolution rate of CO2 into the solution with various CO2 concentrations in the environment for CA-absent and CA-present situations, respectively (in factors 2a and 2b). Illustrated in Figure 4, the dissolution rate of CO2 with CA added is much faster than natural conditions without the use of enzymes, verifying the feasibility of our project design and therefore fulfilling our first objective. | ||
| + | </p> | ||
| + | <center><img src="https://static.igem.org/mediawiki/2019/b/ba/T--Mingdao--Model-fig4.png" alt="" style="max-width:600px;"> | ||
| + | <p class="text-centered" style="margin-left:15%; margin-right:15%;"><b>Figure 4. </b>Comparison of the dissolution rate with and without the use of CA. | ||
</p> | </p> | ||
| − | |||
| − | |||
</center> | </center> | ||
| − | |||
| − | |||
| − | |||
| − | + | <p>By combining the factors 2a through 2d, we defined a rate function v<sub>dissolved</sub>, representing the rate at which carbon dioxide dissolves in water under various circumstances (whether the maximum solubility has been reached and whether CA is utilized). It is a function of the in-device carbon dioxide concentration C<sub>dev</sub>, which is a function of time t and is numerically equivalent to [CO<sub>2(g)</sub>] in previous equations. The mathematical formula for C<sub>dev</sub> can be found and will be discussed further in Equation 11. The definition for v<sub>dissolved</sub> is shown in Equation 9, where C<sub>water</sub> represents the concentration of dissolved carbon dioxide (numerically equivalent to [DIC] in previous equations). | |
| − | + | ||
| − | + | ||
| − | <p> | + | |
</p> | </p> | ||
<center><div class="card mt-3 mb-3" style="width:500px"> | <center><div class="card mt-3 mb-3" style="width:500px"> | ||
| − | <img class="card-img-top" src="" alt="Card image"> | + | <img class="card-img-top" src="https://static.igem.org/mediawiki/2019/2/28/T--Mingdao--Model-equ9.png" alt="Card image"> |
<div class="card-body"> | <div class="card-body"> | ||
| − | <p class="card-text">< | + | <p class="card-text"><b>Equation 9. </b>The equation governing the rate at which carbon dioxide dissolves in water under various circumstances (Refer to Equations 3, 4, 8) |
| + | </p> | ||
| + | </div> | ||
| + | </div> | ||
| + | </center> | ||
| + | |||
| + | <p>The concentration of dissolved carbon dioxide C<sub>water</sub> is dependent on the rate of dissolution (which increases its concentration) and the photosynthetic rate (which decreases its concentration). This is expressed in Equation 10, which models the instantaneous rate of change with the concentration of dissolved carbon dioxide. | ||
</p> | </p> | ||
| − | |||
| − | |||
| − | |||
<center><div class="card mt-3 mb-3" style="width:500px"> | <center><div class="card mt-3 mb-3" style="width:500px"> | ||
| − | <img class="card-img-top" src="" alt="Card image"> | + | <img class="card-img-top" src="https://static.igem.org/mediawiki/2019/9/99/T--Mingdao--Model-equ10.png" alt="Card image"> |
<div class="card-body"> | <div class="card-body"> | ||
| − | <p class="card-text">< | + | <p class="card-text"><b>Equation 10. </b>The equation governing the instantaneous rate of change of in-water CO2 concentration. (From Equations 6, 9, 10, 11) |
| + | </p> | ||
| + | </div> | ||
| + | </div> | ||
| + | </center> | ||
| + | |||
| + | <p>By applying Equation 9, we can calculate the rate of dissolution at any given point in time while Equation 10 allows us to determine whether or not the maximum dissolution capacity C<sub>max</sub> is reached, which is critical in defining Equation 9. Therefore, by combining the factors 2a-2d, we have compiled the decremental rate of CO2 dissolution, which can then be combined with Factor 1 to form the final model for indoor carbon dioxide concentration. | ||
| + | </p> | ||
| + | |||
| + | |||
| + | <h1 id ="d-risk">Our Final Model</h1> | ||
| + | <center><img src="https://static.igem.org/mediawiki/2019/b/b7/T--Mingdao--Model-final.png" alt="" style="max-width:800px;"></center> | ||
| + | |||
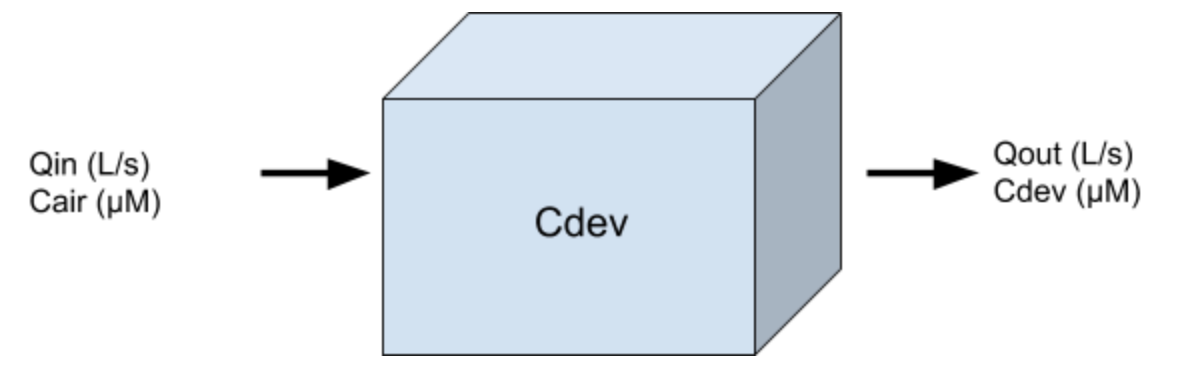
| + | <p>Before combining all the equations, one thing to note is that our prototype is a closed system as shown above. Therefore, a concentration variable C<sub>dev</sub> is defined to denote the concentration of gaseous carbon dioxide in the system. Q<sub>in</sub> and Q<sub>out</sub> refer to the inflow and outflow rate of this closed system, while C<sub>air</sub> (the ambient carbon dioxide concentration) and C<sub>dev</sub> (the gaseous carbon dioxide concentration in device) are the inflow and outflow concentrations. The concentration of gaseous carbon dioxide in the system can be modeled with the differential equation, Equation 11, where V<sub>dev</sub> represents the volume of in-device gas. | ||
</p> | </p> | ||
| − | |||
| − | |||
| − | |||
<center><div class="card mt-3 mb-3" style="width:500px"> | <center><div class="card mt-3 mb-3" style="width:500px"> | ||
| − | <img class="card-img-top" src="" alt="Card image"> | + | <img class="card-img-top" src="https://static.igem.org/mediawiki/2019/b/bb/T--Mingdao--Model-equ11.png" alt="Card image"> |
<div class="card-body"> | <div class="card-body"> | ||
| − | <p class="card-text">< | + | <p class="card-text"><b>Equation 11. </b>The equation governing the instantaneous rate of change of in-device gaseous CO2 concentration. (From Equations 6, 9, 11) |
| + | </p> | ||
| + | </div> | ||
| + | </div> | ||
| + | </center> | ||
| + | <p>By integrating factors 1-3, the final equation representing the instantaneous rate of change of indoor carbon dioxide concentration is derived with respect to human production rate, CO2 dissolution rate and the flow rate of our device. All variables used in the final equation are listed in Table 6. | ||
</p> | </p> | ||
| − | + | ||
| − | + | ||
| − | + | ||
<center><div class="card mt-3 mb-3" style="width:500px"> | <center><div class="card mt-3 mb-3" style="width:500px"> | ||
| − | <img class="card-img-top" src="" alt="Card image"> | + | <img class="card-img-top" src="https://static.igem.org/mediawiki/2019/0/04/T--Mingdao--Model-equ12.png" alt="Card image"> |
<div class="card-body"> | <div class="card-body"> | ||
| − | <p class="card-text">< | + | <p class="card-text"><b>Equation 12. </b>The final model that demonstrates the instantaneous change in CO2 concentration in the air, with human exhalation, photosynthesis, and enzyme activity of CA taken into consideration. V<sub>room</sub> signifies the volume of the room modeled while V<sub>water</sub> indicates the in-device volume of the liquid that contains cyanobacteria (From Equations 2, 9, 10) |
| + | </p> | ||
| + | </div> | ||
| + | </div> | ||
| + | </center> | ||
| + | |||
| + | <h3>Final Model: Discussion</h3> | ||
| + | <p>While the enzymatic coefficients for CA, v<sub>max</sub>, is obtained from literature, it is highly dependent on factors such as the quality and activity of the enzyme, and hence differs greatly from a literature source to another. The value of v<sub>max</sub> for hCAII ranges from 414 μM, as seen in research done by Parkes <i>et al.</i>, all the way to our previous calculation, 4.0362×10<sup>9</sup>, citing Silverman <i>et al.</i> Therefore, to get a more reliable value, we adjusted v<sub>max</sub> in our model using our experimental data shown in Table 5. In our experiment, the inflow is from carbon dioxide gas tanks, and therefore the inflow concentration (C<sub>air</sub>) is set at constant while the outflow concentration (C<sub>dev</sub>) is measured. A modified v<sub>max</sub> value of 2213 μM is acquired from empirical data by averaging the respective v<sub>max</sub> values in our model for each trial to reach the outflow concentration (C<sub>dev</sub>) measured from the experiment. By adjusting the vmax value to fit all sets of experimental data, we plotted our theoretical model against experimental data, as shown in Figure 5. A high correlation between our experimental data with the theoretical data is shown, suggesting that our model is practical and reliable. | ||
</p> | </p> | ||
| − | </ | + | |
| − | </ | + | <center><img src="https://static.igem.org/mediawiki/2019/0/02/T--Mingdao--Model-51.png" alt="" style="max-width:800px;"> |
| − | </center> | + | <p style="margin-left:10%;margin-right:10%"><b>Table 5. </b>Experimental results used to determine the value of v<sub>max</sub>. </p></center> |
| − | <center><img src="" alt="" style="max-width: | + | |
| − | < | + | <center><img src="https://static.igem.org/mediawiki/2019/d/d5/T--Mingdao--Model-fig5.png" alt="" style="max-width:800px;"> |
| − | <p> | + | <p style="margin-left:10%;margin-right:10%"><b>Figure 5. </b>Graphing the modified model against experimental data. </p></center> |
| − | In order to | + | |
| + | <p>In order to verify the reliability of our mathematical model in simulating how the indoor CO2 concentration changes over time, we also conducted an experiment with 10 people in a small room for 22 minutes. The experimental and theoretical values are shown below in Figure 6. More details about the experiment can be shown on the "Experiment" page. | ||
</p> | </p> | ||
| − | <h1 id ="d-manage">References</h1> | + | <center><img src="https://static.igem.org/mediawiki/2019/f/f7/T--Mingdao--Model-fig6.png" alt="" style="max-width:800px;"> |
| + | <p style="margin-left:10%;margin-right:10%"><b>Figure 6. </b>Modeling Indoor Concentration of CO2 with 10 people in an enclosed room. | ||
| + | With the data we obtained from the experiment, both with and without using our prototype, we were able to see the agreement of theoretical data calculated from our model and experimental data. Our model reaches its optimal stability after roughly 18 minutes. After it has reached a more steady state, our experimental data and theoretical values are in harmony. All variables used in our final model are provided in Table 6. | ||
| + | </p></center> | ||
| + | |||
| + | <center><img src="https://static.igem.org/mediawiki/2019/3/39/T--Mingdao--Model-tab6.png" alt="" style="max-width:800px;"> | ||
| + | <p style="margin-left:10%;margin-right:10%"><b>Table 6. </b> Parameters used in the final model for C<sub>air</sub>. | ||
| + | </p></center> | ||
| + | |||
| + | <h1 id ="d-soft">Our Software</h1> | ||
| + | <p>In order to graphically represent the effect of our project prototype and simulate the change in indoor CO2 concentration over time, we have constructed a simulator based on all the formulas discussed, which considers human CO2 production rate, the enzymatic activity of CA, the photosynthetic rate of cyanobacteria and the maximum solubility of CO2 in water. Alterable variables including the number of people in the room (n), the volume of the room (V<sub>room</sub>), initial indoor CO2 concentration (initial C<sub>air</sub>) and the human exhalation rate (Q<sub>ex</sub>) and concentration (C<sub>ex</sub>) are provided for users to dynamically adjust the simulator to a particular condition. This simulator can help researchers and consumers of our prototype to better understand the effect of our product, <i>CAir Pro™</i>. | ||
| + | </p> | ||
| + | <div class="jumbotron"> | ||
| + | <h2 style="font-size: 48px; color: rgb(20,50,150); font-weight: 500;">Indoor CO2 concentration Simulator</h2> | ||
| + | <h3>Variable Input:</h3> | ||
| + | <div class="form-group"> | ||
| + | <label for="cair_initial">Initial Indoor CO2 Concentration:</label> | ||
| + | <div class="input-group"> | ||
| + | <input type="number" min="0" maxlength="4" class="form-control" id="cair_initial" value="450"> | ||
| + | <div class="input-group-append"> | ||
| + | <span class="input-group-text">ppm</span> | ||
| + | </div> | ||
| + | </div> | ||
| + | </div> | ||
| + | |||
| + | <div class="form-group"> | ||
| + | <label for="num_of_people">Number of People:</label> | ||
| + | <input type="number" min="0" max="100" class="form-control" id="num_of_people" value="1"> | ||
| + | </div> | ||
| + | <div class="form-group"> | ||
| + | <label for="num_of_devices">Number of CAir Pro Devices:</label> | ||
| + | <input type="number" min="0" max="100" class="form-control" id="num_of_devices" value="1"> | ||
| + | </div> | ||
| + | <div class="form-group"> | ||
| + | <label for="room_volume">Room Volume:</label> | ||
| + | <div class="input-group"> | ||
| + | <input type="number" min="0" class="form-control" id="room_volume" value="200"> | ||
| + | <div class="input-group-append"> | ||
| + | <span class="input-group-text">m<sup>3</sup></span> | ||
| + | </div> | ||
| + | </div> | ||
| + | </div> | ||
| + | <div class="form-group"> | ||
| + | <label for="duration">Simulation Duration:</label> | ||
| + | <select class="form-control" id="duration"> | ||
| + | <option value="600">10 min</option> | ||
| + | <option value="1800">30 min</option> | ||
| + | <option value="3600" selected>1 hr</option> | ||
| + | <option value="7200">2 hr</option> | ||
| + | </select> | ||
| + | </div> | ||
| + | <h3>Advanced Settings:</h3> | ||
| + | <div class="form-group"> | ||
| + | <label for="exhale_rate">Exhalation Rate of an Individual:</label> | ||
| + | <div class="input-group"> | ||
| + | <input type="number" min="0" class="form-control" id="exhale_rate" value="935"> | ||
| + | <div class="input-group-append"> | ||
| + | <span class="input-group-text">mL/min</span> | ||
| + | </div> | ||
| + | </div> | ||
| + | </div> | ||
| + | <div class="form-group"> | ||
| + | <label for="exhale_conc">Exhalation Concentration of an Individual:</label> | ||
| + | <div class="input-group"> | ||
| + | <input type="number" min="0" class="form-control" id="exhale_conc" value="47000"> | ||
| + | <div class="input-group-append"> | ||
| + | <span class="input-group-text">ppm</span> | ||
| + | </div> | ||
| + | </div> | ||
| + | </div> | ||
| + | |||
| + | <button class="btn btn-primary" id="simulate_btn">Simulate!</button> | ||
| + | |||
| + | <div id="chartContainer" style="height: 370px; max-width: 920px; margin: 0px auto; margin-top:20px; border: 1px black" ></div> | ||
| + | <script type="text/javascript" src="https://2019.igem.org/Template:Mingdao/JS/CanvasJS? | ||
| + | action=raw&ctype=text/javascript"></script> | ||
| + | |||
| + | </div> | ||
| + | |||
| + | <h1 id ="d-conc">Conclusion</h1> | ||
| + | <p>By taking into consideration both the incremental and decremental factors of indoor carbon dioxide concentration, adopting the Michaelis-Menten Kinetics to model enzyme activities of CA at various substrate concentrations, utilizing basic aerodynamics to determine the flow of gas into and out of our device, we were able to eventually come up with a reliable model that corresponds with our experimental data, as shown in Figure 6. A dynamic simulator was created in conjunction with our model to help graphically illustrate how indoor carbon dioxide concentration changes over time in various situations, including the number of people in the room, the volume of the room, and the number of <i>CAir Pro™</i> devices used. The data obtained from our model are used frequently throughout our project development to test the feasibility of our ideas and the effect of our prototype.</p> | ||
| + | |||
| + | <h1 id="d-manage">References</h1> | ||
<ol> | <ol> | ||
| − | <li>Clark, D. R., and K. J. Flynn. “The Relationship between the Dissolved Inorganic Carbon Concentration and Growth Rate in Marine Phytoplankton.” Proceedings of the Royal Society of London. Series B: Biological Sciences, vol. 267, no. 1447, 2000, pp. 953–959., doi:10.1098/rspb.2000.1096. | + | <li>Clark, D. R., and K. J. Flynn. “The Relationship between the Dissolved Inorganic Carbon Concentration and Growth Rate in Marine Phytoplankton.” <i>Proceedings of the Royal Society of London. Series B: Biological Sciences</i>, vol. 267, no. 1447, 2000, pp. 953–959., doi:10.1098/rspb.2000.1096. |
</li> | </li> | ||
| − | <li>Collier, Jackie L., et al. “Changes in the Cyanobacterial Photosynthetic Apparatus during Acclimation to Macronutrient Deprivation.” Photosynthesis Research, vol. 42, no. 3, 1994, pp. 173–183., doi:10.1007/bf00018260. | + | <li>Collier, Jackie L., et al. “Changes in the Cyanobacterial Photosynthetic Apparatus during Acclimation to Macronutrient Deprivation.” <i>Photosynthesis Research</i>, vol. 42, no. 3, 1994, pp. 173–183., doi:10.1007/bf00018260. |
</li> | </li> | ||
<li>“Dissolved Carbon Dioxide”, http://ion.chem.usu.edu/~sbialkow/Classes/3650/CO2 Solubility/DissolvedCO2.html. | <li>“Dissolved Carbon Dioxide”, http://ion.chem.usu.edu/~sbialkow/Classes/3650/CO2 Solubility/DissolvedCO2.html. | ||
</li> | </li> | ||
| − | <li>Jung, Heejung. “Modeling CO2 Concentrations in Vehicle Cabin.” SAE Technical Paper Series, 2013, doi:10.4271/2013-01-1497. | + | <li>Jung, Heejung. “Modeling CO2 Concentrations in Vehicle Cabin.” <i>SAE Technical Paper Series</i>, 2013, doi:10.4271/2013-01-1497. |
</li> | </li> | ||
| − | <li>Keren, Nir, et al. “A Light-Dependent Mechanism for Massive Accumulation of Manganese in the Photosynthetic BacteriumSynechocystissp. PCC 6803†.” Biochemistry, vol. 41, no. 50, 2002, pp. 15085–15092., doi:10.1021/bi026892s. | + | <li>Keren, Nir, et al. “A Light-Dependent Mechanism for Massive Accumulation of Manganese in the Photosynthetic BacteriumSynechocystissp. PCC 6803†.” <i>Biochemistry</i>, vol. 41, no. 50, 2002, pp. 15085–15092., doi:10.1021/bi026892s. |
</li> | </li> | ||
| − | <li>Sander, R. “Compilation of Henrys Law Constants (Version 4.0) for Water as Solvent.” Atmospheric Chemistry and Physics, vol. 15, no. 8, 2015, pp. 4399–4981., doi:10.5194/acp-15-4399-2015. | + | <li>Parkes, Joan Lee, and Peter S. Coleman. “Enhancement of Carbonic Anhydrase Activity by Erythrocyte Membranes.” <i>Archives of Biochemistry and Biophysics</i>, vol. 275, no. 2, 1989, pp. 459–468., doi:10.1016/0003-9861(89)90392-5.</li> |
| + | <li>Sander, R. “Compilation of Henrys Law Constants (Version 4.0) for Water as Solvent.” <i>Atmospheric Chemistry and Physics</i>, vol. 15, no. 8, 2015, pp. 4399–4981., doi:10.5194/acp-15-4399-2015. | ||
</li> | </li> | ||
| − | <li>Silverman, David N., and Sven Lindskog. “The Catalytic Mechanism of Carbonic Anhydrase: Implications of a Rate-Limiting Protolysis of Water.” Accounts of Chemical Research, vol. 21, no. 1, 1 Jan. 1988, pp. 30–36., doi:10.1021/ar00145a005. | + | <li>Silverman, David N., and Sven Lindskog. “The Catalytic Mechanism of Carbonic Anhydrase: Implications of a Rate-Limiting Protolysis of Water.” <i>Accounts of Chemical Research</i>, vol. 21, no. 1, 1 Jan. 1988, pp. 30–36., doi:10.1021/ar00145a005. |
</li> | </li> | ||
| − | <li>Turpin, David H., et al. “Predicting The Kinetics Of Dissolved Inorganic Carbon Limited Growth From The Short-Term Kinetics Of Photosynthesis In Synechococcus Leopoliensis (Cyanophyta)1.” Journal of Phycology, vol. 21, no. 3, 2004, pp. 409–418., doi:10.1111/j.0022-3646.1985.00409.x. | + | <li>Turpin, David H., et al. “Predicting The Kinetics Of Dissolved Inorganic Carbon Limited Growth From The Short-Term Kinetics Of Photosynthesis In Synechococcus Leopoliensis (Cyanophyta)1.” <i>Journal of Phycology</i>, vol. 21, no. 3, 2004, pp. 409–418., doi:10.1111/j.0022-3646.1985.00409.x. |
</li> | </li> | ||
</ol> | </ol> | ||
| Line 378: | Line 533: | ||
$('html, body').animate({ | $('html, body').animate({ | ||
scrollTop: $("#d-risk").offset().top-50 | scrollTop: $("#d-risk").offset().top-50 | ||
| + | }, 700); | ||
| + | }); | ||
| + | $("#soft-s-btn").click(function() { | ||
| + | $('html, body').animate({ | ||
| + | scrollTop: $("#d-soft").offset().top-50 | ||
| + | }, 700); | ||
| + | }); | ||
| + | $("#conc-s-btn").click(function() { | ||
| + | $('html, body').animate({ | ||
| + | scrollTop: $("#d-conc").offset().top-50 | ||
}, 700); | }, 700); | ||
}); | }); | ||
| Line 399: | Line 564: | ||
d_goal_pos = $("#d-goal").offset().top-52 | d_goal_pos = $("#d-goal").offset().top-52 | ||
d_risk_pos = $("#d-risk").offset().top-52 | d_risk_pos = $("#d-risk").offset().top-52 | ||
| + | d_soft_pos = $("#d-soft").offset().top-52 | ||
| + | d_conc_pos = $("#d-conc").offset().top-52 | ||
d_manage_pos = $("#d-manage").offset().top-52 | d_manage_pos = $("#d-manage").offset().top-52 | ||
| Line 422: | Line 589: | ||
// pathogen | // pathogen | ||
| − | else if(scroll_pos < | + | else if(scroll_pos < d_soft_pos){ |
if(scroll_pos >= d_risk_pos){ | if(scroll_pos >= d_risk_pos){ | ||
$(".path-dot").css('background-color', '#fff') | $(".path-dot").css('background-color', '#fff') | ||
$("#risk-s-btn").css('background-color', '#385e66');} | $("#risk-s-btn").css('background-color', '#385e66');} | ||
| + | } | ||
| + | |||
| + | // software | ||
| + | else if(scroll_pos < d_conc_pos){ | ||
| + | if(scroll_pos >= d_risk_pos){ | ||
| + | $(".path-dot").css('background-color', '#fff') | ||
| + | $("#soft-s-btn").css('background-color', '#385e66');} | ||
| + | } | ||
| + | |||
| + | // conclusion | ||
| + | else if(scroll_pos < d_manage_pos){ | ||
| + | if(scroll_pos >= d_risk_pos){ | ||
| + | $(".path-dot").css('background-color', '#fff') | ||
| + | $("#conc-s-btn").css('background-color', '#385e66');} | ||
} | } | ||
Latest revision as of 03:18, 22 October 2019

Objectives
Incremental Factors
Decremental Factors
Final Model
Our Software
Conclusion
References
Objectives
The objectives of our mathematical model are to:
- Demonstrate and prove the feasibility of our project design by showing how adding human carbonic anhydrase II (abbreviated as CA or hCAII) affects the dissolution rate of carbon dioxide in water, as opposed to natural conditions without CA.
- Predict how the indoor CO2 concentration changes over time, given the number of people in the room, the exact volume of the room, and whether or not CA is utilized.
Our model is based on two major assumptions. For the sake of simplicity, we assume that the space under examination is enclosed and airtight, meaning that inflow to and outflow from the room are both eliminated. In addition, regarding the air conditioning, which is a major source of airflow, since internal air is recirculated without interacting with external air with most modern air conditioning systems, it can be assumed that air conditioning does not affect the indoor carbon dioxide level.
OVERVIEW OF MODEL PARAMETERS
Several factors influence the CO2 concentration in an enclosed space (such as a meeting room), namely the following:
- Incremental - The incremental factors of CO2 concentration in an enclosed space represent the additive effect of CO2 from human respiration, which is influenced by the following factors:
- The number of people in the space.
- The average exhalation rate per person.
- The average CO2 concentration in exhalation.
- Decremental - The decremental factors of CO2 concentration within our system are mainly from our device, which consists of a solution of cyanobacteria (Synechococcus elongatus PCC7942) as well as human carbonic anhydrase II (hCAII), thus, the following factors are considered:
- The natural dissolution rate of CO2 in water (when CA is absent).
- The dissolution rate of CO2 in water when CA is present, expressed as the enzymatic reaction rate of CA.
- The rate of CO2 consumption from the photosynthesis of cyanobacteria.
- The solubility of CO2 in water at various acidities.
- Other - The factors listed below also affect the instantaneous indoor CO2 concentration within our model, and are addressed as input variables for our model.
- The volume of the enclosed space.
- Initial indoor CO2 concentration.
- The flow rate of device inflow.
We obtained literature values and models for Factors 1b, 1c, and 2.
Factors 1a and 3 are treated as independent variables in the model that can be input accordingly to calculate the indoor CO2 concentration.
Factor 1: Modeling the CO2 Produced by Human Exhalation
In order to come up with a comprehensive mathematical model, we decided to start by modeling the indoor CO2 concentration over time, considering human breathing. The indoor CO2 concentration in this case can be modeled with the following formula (Jung).

Equation 1. The governing equation modeling the concentration of carbon dioxide (C) in an enclosed space at a specific time (t), given the number of people in the room (n), the CO2 concentration in exhalation (Cex), the exhalation flow rate (Qex), the volume of the room (Vroom), and the initial indoor CO2 concentration (C0).
In order to better combine this equation with other factors of our model, we rewrote Equation 1 into its differential form and defined it as the instantaneous rate of human production of CO2 by exhalation at time t, vhuman(t).
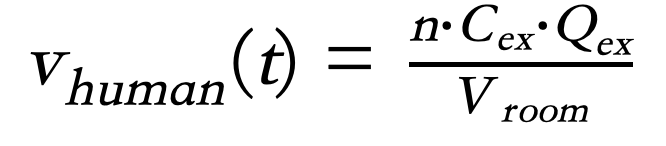
Equation 2. The instantaneous change in indoor CO2 concentration from human respiration (derivative of Equation 1).
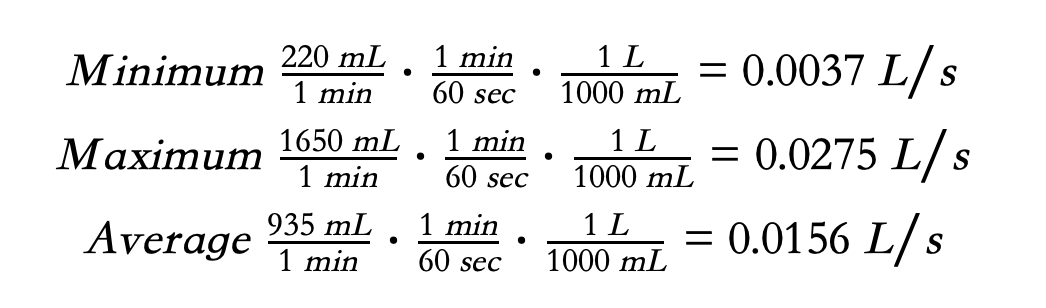
Factor 1b: Determining the Exhalation Rate of an Individual (Qex)
Exhalation rate is the amount of air that an individual exhales per unit time. From literature, the exhalation rate of an individual is shown below (Jung). The default value used in our model is calculated by the average of minimum and maximum values. Unit conversions are shown below.
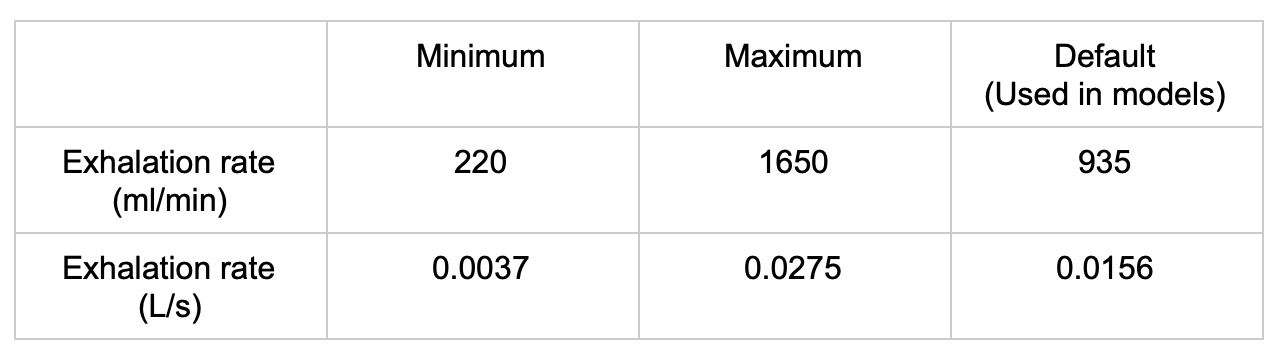
Table 1. Exhalation rate of an individual with unit conversion (Jung)
Factor 1c: Determining the CO2 Concentration in Exhalation (Cex)
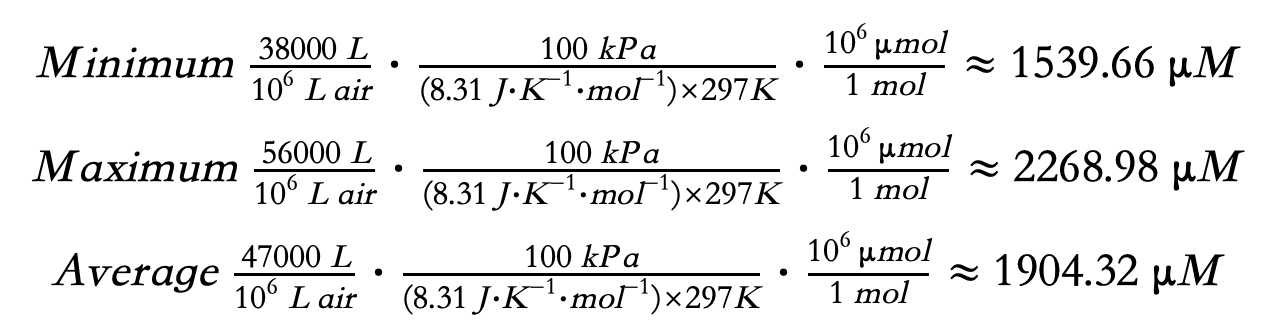
The CO2 concentration of an individual's breathing varies highly and is dependent on the individual and their condition. The CO2 concentration in exhalation from literature is shown below (Jung). The average of minimum and maximum values is used as the default value in our model to provide a general representation of the variable. Unit conversions are shown below, with assumptions of an environment with an air pressure of 100 kPa and an air temperature of 25 ℃ (or 297 K).
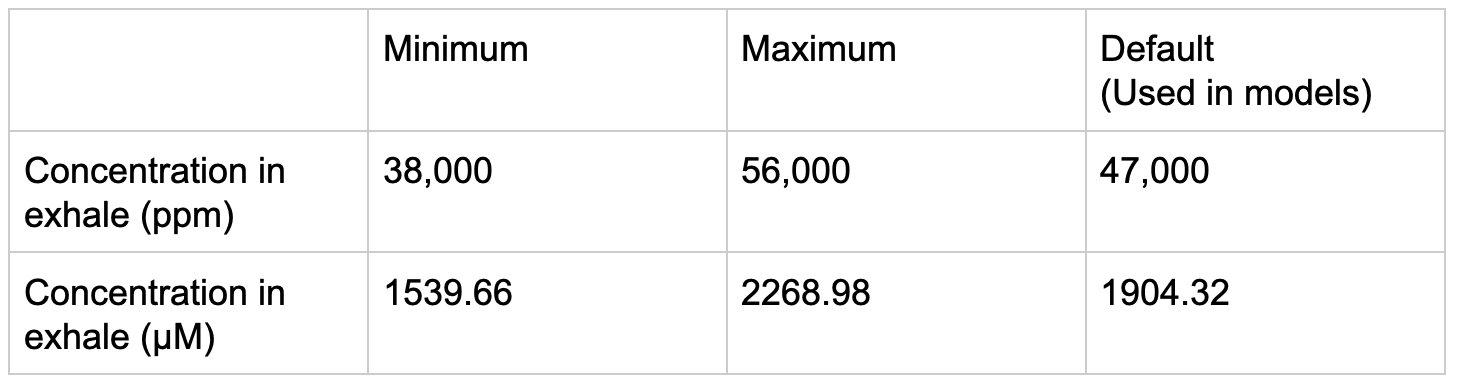
Table 2. CO2 concentration in exhalation with unit conversion (Jung)
Factor 1: Discussion
The total amount of CO2 produced by an individual per unit time can be calculated by multiplying the exhalation rate of an individual (factor 1b, obtained from literature) with the CO2 concentration in exhalation (factor 1c, obtained from literature). The derived value can then be multiplied by the number of people and divided by the volume of the room to compute for the instantaneous rate of CO2 production by human exhalation (Equation 2). The equation in this factor governs the effect of human exhalation on indoor CO2 concentration.
Factor 2: Modeling the Factors that Reduce Carbon Dioxide
The CO2 fixation process can be illustrated with the following diagram.
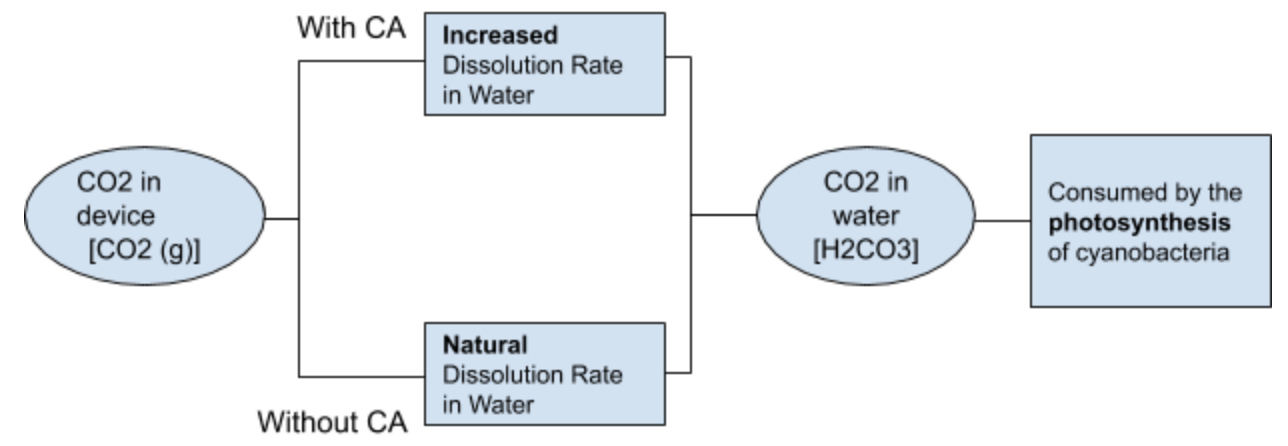
Therefore, the process of defining the sequestration of CO2 in our model can be divided into two aspects: determining the natural dissolution rate of CO2 in water (when CA is absent, factor 2a) and determining the increased dissolution rate of CO2 in water (when CA is present, factor 2b). However, the dissolved inorganic carbon (DIC; which implies the combination of H2CO3, HCO3-, CO32-, and all other forms of dissolved carbon dioxide) in water can eventually reach its maximum capacity, which is dependent on the pH value of the environment (factor 2c). How rapidly this theoretical maximum is attained is dependent on the photosynthetic rate of cyanobacteria (factor 2d).
Factor 2a: Determining the Natural Dissolution Rate of CO2 in Water
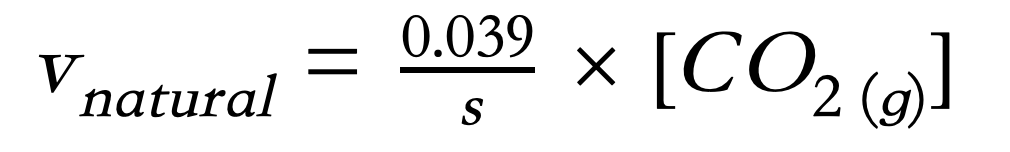
The natural dissolution rate of CO2 in water (vnatural) is calculated using the first-order rate constant equation, as shown in Equation 3, where 0.039 s-1 is the rate constant for the forward reaction of the hydration of carbon dioxide ($ CO_2 + H_2O\rightarrow H_2CO_3 $). The correlation between the concentration of gaseous carbon dioxide and the natural dissolution rate is illustrated in Figure 1.
Equation 3. First-order rate constant equation for hydration of carbon dioxide.
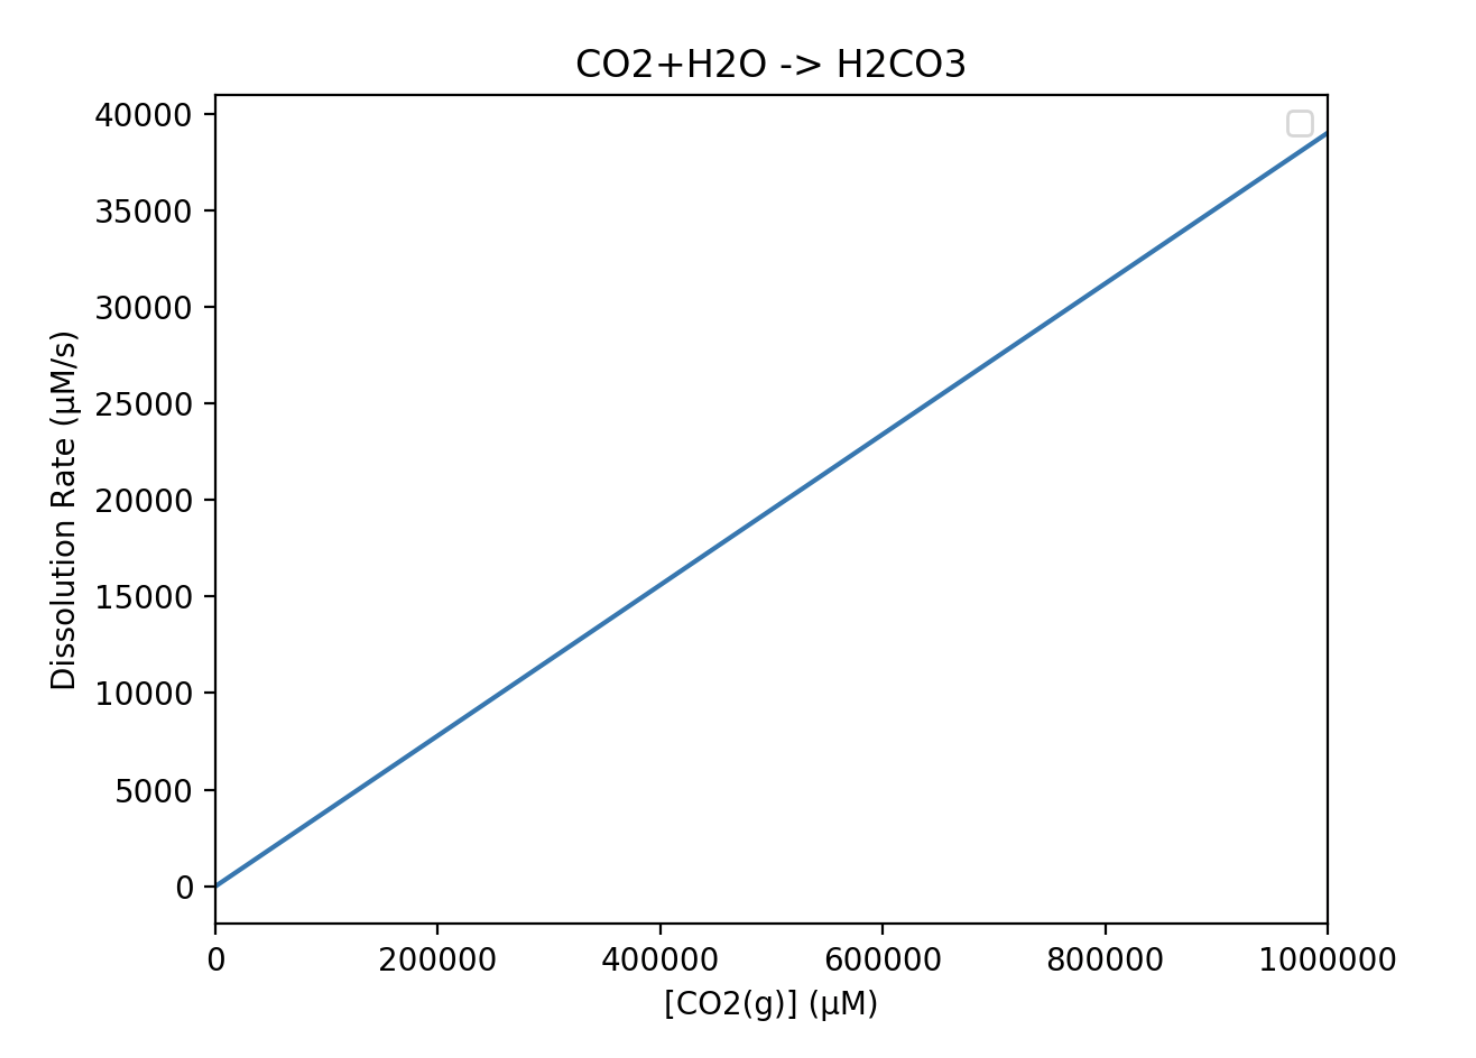
Figure 1. The linear curve modeling the correlation between the concentration of gaseous carbon dioxide and its natural dissolution rate in water.
Equation 3 exhibits a linear relationship between the concentration of gaseous carbon dioxide and its natural dissolution rate in water, which increases with the concentration of gaseous CO2. This relation is applied to model the indoor carbon dioxide level when CA is not added, serving as the control group.
Factor 2b: Determining the Enzymatic Reaction Rate of CA
We modeled the enzymatic rate of carbonic anhydrase with Michaelis-Menten kinetics, as shown in Equation 4. vCA represents the enzymatic reaction rate of CA; [CO2(g)] represents the concentration of substrate (in this case, gaseous carbon dioxide); vmax represents the maximum reaction rate possible; and Km is the Michaelis-Menten constant, which is defined as the substrate concentration when the enzymatic reaction rate is half of its maximum (when $v=\frac12 v_{max} $).
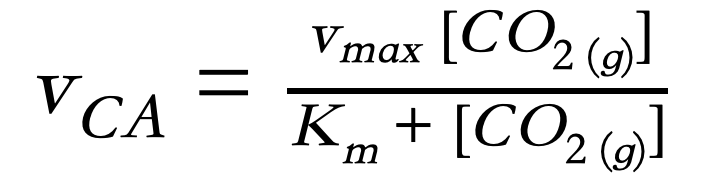
Equation 4. The Michaelis-Menten equation, which models the relationship between the concentration of gaseous carbon dioxide and the enzymatic reaction rate.
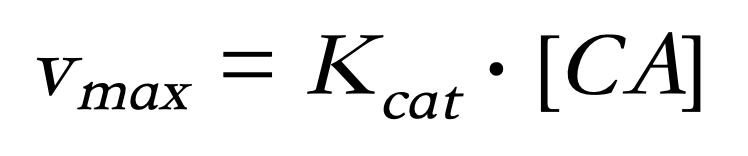
Equation 5. Calculation for vmax, the maximum reaction rate. Kcat denotes the catalyst rate constant of CA and [CA] represents the concentration of the enzyme.
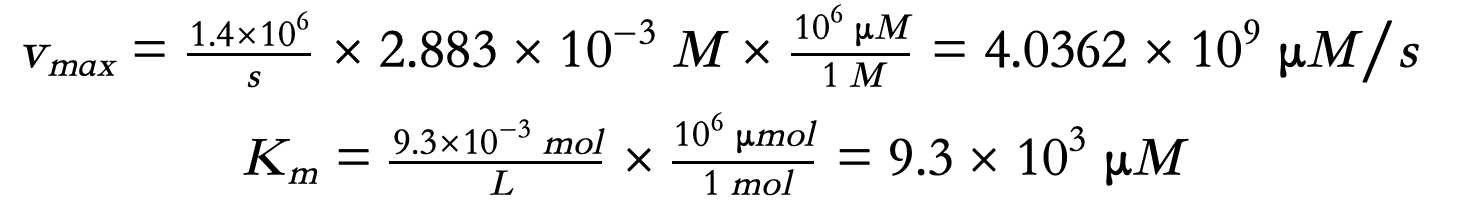
Therefore, by inserting the vmax and Km values into the model, the correlation between CO2 concentration and the reaction rate of CA can be shown. vmax can be calculated with Equation 5.
We obtained the Kcat and Km values for the human carbonic anhydrase II (hCAII) from literature. According to Silverman et al., the Kcat and Km values for hCAII are 1.4×10⁶ s-1 and 9.3×10⁻³ M, respectively. A [CA] value of 2.883×10⁻³ M is used based on the enzyme we use. Unit conversions are shown below.
Using the enzymatic coefficients for the Michaelis-Menten model, we plotted the curve in Figure 2 to model the enzyme kinetics of human carbonic anhydrase II.
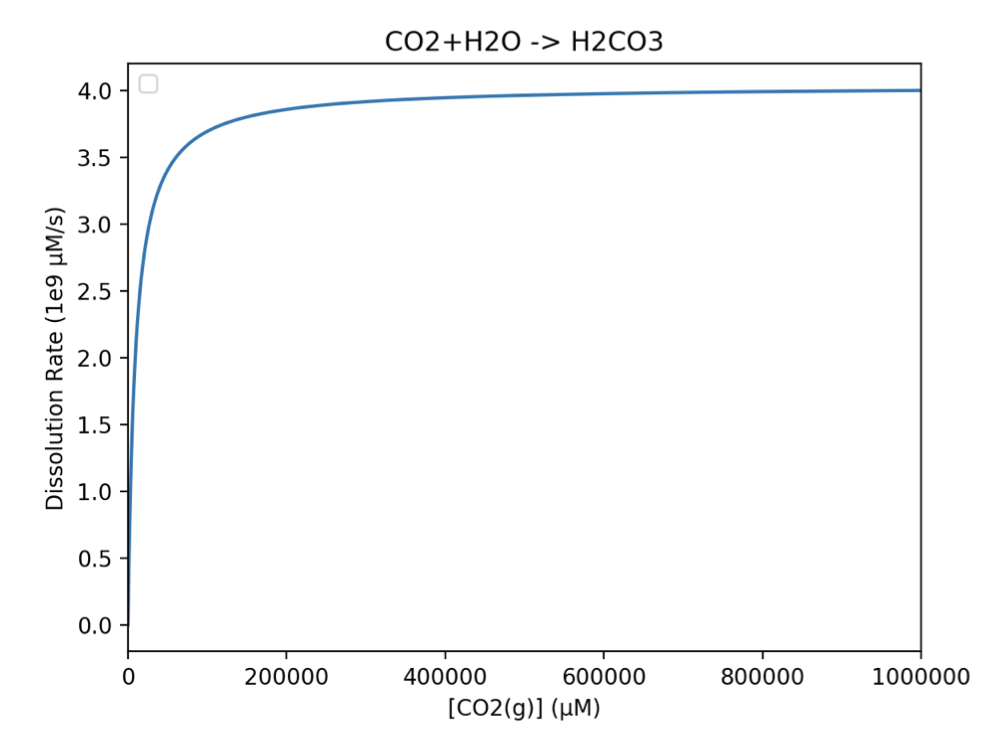
Figure 2. The Michaelis-Menten curve modeling the enzyme activities of hCAII at various concentrations of carbon dioxide.
The curve above reveals a hyperbolic relationship between the concentration of gaseous carbon dioxide and its dissolution rate, with a greater dissolution rate compared with the natural dissolution rate. This verifies the feasibility of using carbonic anhydrase to increase the dissolution rate of carbon dioxide in our project design.
Factor 2c: Determining the Photosynthetic Rate of Cyanobacteria in the Form of CO2 Consumption
After carbon dioxide has fully hydrated and dissolved in water, the last phase in our process of CO2 sequestration is its removal by the photosynthesis of cyanobacteria Synechococcus elongatus PCC7942. The rate at which the dissolved CO2 is consumed by our cyanobacteria can be modeled with Equation 5, which models the relationship between the concentration of dissolved inorganic carbon (DIC) and the rate of carbon-specific growth (Cμ; which is also equivalent to the rate of photosynthesis vphotosynthesis), which is represented in the form of O2 production (Clark). The conversion from the amount of O2 production to CO2 sequestration is then performed using the 1:1 molar ratio between O2 and CO2 obtained from the chemical equation of photosynthesis. The maximum rate of growth μmax and the half-saturation constant for Cμ, KG(DIC), specific for the cyanobacteria Synechococcus are consulted from literature. Calculations for the final function are shown below with the parameters listed in Table 3.
Equation 6. Relationship between the rate of photosynthesis (vphotosynthesis) and the concentration of dissolved inorganic carbon (DIC) (Clark).
Table 3. Parameters used in the calculation for Cμ
Using the converted photosynthetic coefficients that we obtained through literature for our cyanobacteria Synechococcus elongatus, we constructed a graph in Figure 3 showing the relationship between the concentration of dissolved inorganic carbon in water and the rate of CO2 consumption due to photosynthesis.
Figure 3. The Michaelis-Menten curve modeling the photosynthetic activity of Synechococcus elongatus. The CO2 consumption rate at various concentrations of dissolved inorganic carbon (DIC) is shown.
This model exhibits a hyperbolic relationship, peaking the CO2 consumption rate with 0.6865 μmol/s at approximately 400 μM, after which the maximum productivity is reached and can no longer increase further.
Factor 2d: Determining the Solubility of CO2 in Alkaline Environments
In order to model the maximum dissolvable amount of carbon dioxide in alkaline environments, we first used the Henry's Law (Equation 7), which states that the concentration (C) of a gas in liquid is equal to its partial pressure (Pgas) multiplied by the Henry's law solubility constant (Hcp).
Equation 7. Henry's Law, modeling the relationship between the partial pressure of gas and its concentration in a solvent.
From Sander (2015), the Henry's law constant (Hcp) of carbon dioxide at 25 °C with water as a solvent is 3.3 ⨉ 10-4 mol·m-3·Pa-1. Unit conversion is shown below.

Assuming the concentration of CO2 in air is 400 ppm and the air pressure is 1 atm, the concentration of CO2 in water can be calculated as the following:

With the rates of the dissolution of CO2 identified both with or without the addition of CA, it is crucial to note that an enzyme does not increase the final yield of products, but instead accelerates its reaction rate. Therefore, it is critical to identify the maximum attainable concentration in water. It is also essential to note that the solvent we use in our project is a culture medium for Synechococcus elongatus and is alkaline with a pH value of 11. The effect of pH on solubility is summarized by the following equation, with the maximum concentration from Henry’s Law considered as [CO2 (aq)]:

Equation 8. An extension of the Henry’s Law that determines the maximum solubility of carbon dioxide in water considering the acidity of the reaction environment.
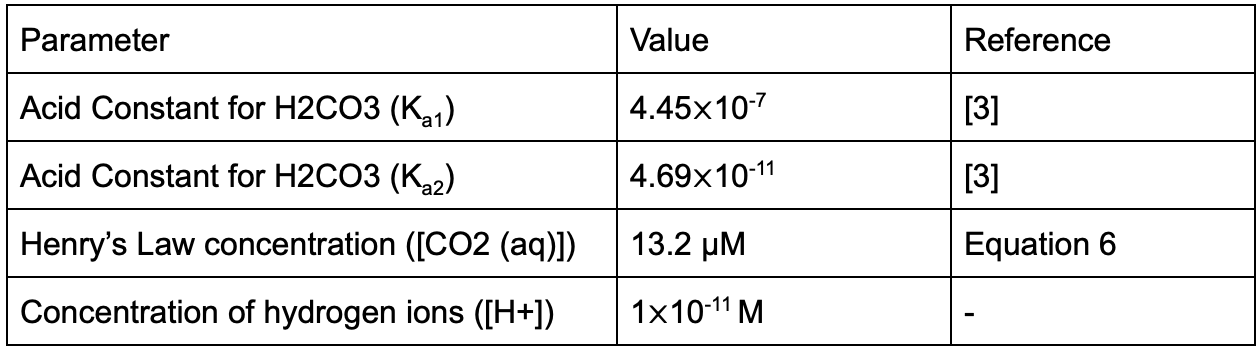
Table 4. Parameters used in the calculation for the maximum attainable concentration of carbon dioxide in water Cmax in alkaline environments.
Therefore the calculation shows:
The calculation from Equation 8 reveals that at 1 atm, 25 °C in a pH11 solution, the maximum dissolvable amount of carbon dioxide is 3.34⨉106 μM. Once the maximum capacity is reached, carbon dioxide can no longer dissolve in the solution, regardless of whether or not enzymes are utilized.
Factor 2: Discussion
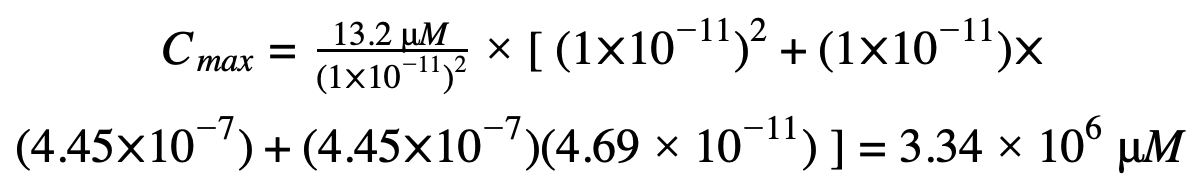
From the calculations above, we adopted the first-order rate constant equation and the Michaelis-Menten model to determine the dissolution rate of CO2 into the solution with various CO2 concentrations in the environment for CA-absent and CA-present situations, respectively (in factors 2a and 2b). Illustrated in Figure 4, the dissolution rate of CO2 with CA added is much faster than natural conditions without the use of enzymes, verifying the feasibility of our project design and therefore fulfilling our first objective.
Figure 4. Comparison of the dissolution rate with and without the use of CA.
By combining the factors 2a through 2d, we defined a rate function vdissolved, representing the rate at which carbon dioxide dissolves in water under various circumstances (whether the maximum solubility has been reached and whether CA is utilized). It is a function of the in-device carbon dioxide concentration Cdev, which is a function of time t and is numerically equivalent to [CO2(g)] in previous equations. The mathematical formula for Cdev can be found and will be discussed further in Equation 11. The definition for vdissolved is shown in Equation 9, where Cwater represents the concentration of dissolved carbon dioxide (numerically equivalent to [DIC] in previous equations).
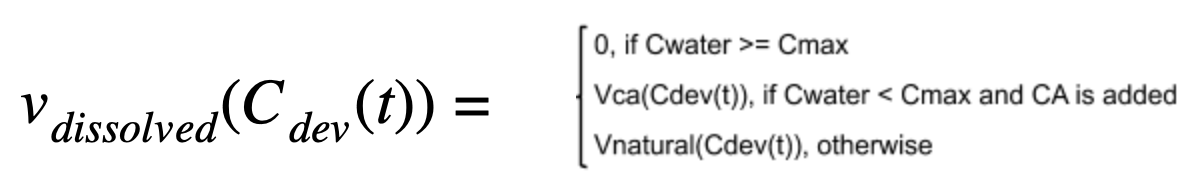
Equation 9. The equation governing the rate at which carbon dioxide dissolves in water under various circumstances (Refer to Equations 3, 4, 8)
The concentration of dissolved carbon dioxide Cwater is dependent on the rate of dissolution (which increases its concentration) and the photosynthetic rate (which decreases its concentration). This is expressed in Equation 10, which models the instantaneous rate of change with the concentration of dissolved carbon dioxide.

Equation 10. The equation governing the instantaneous rate of change of in-water CO2 concentration. (From Equations 6, 9, 10, 11)
By applying Equation 9, we can calculate the rate of dissolution at any given point in time while Equation 10 allows us to determine whether or not the maximum dissolution capacity Cmax is reached, which is critical in defining Equation 9. Therefore, by combining the factors 2a-2d, we have compiled the decremental rate of CO2 dissolution, which can then be combined with Factor 1 to form the final model for indoor carbon dioxide concentration.
Our Final Model
Before combining all the equations, one thing to note is that our prototype is a closed system as shown above. Therefore, a concentration variable Cdev is defined to denote the concentration of gaseous carbon dioxide in the system. Qin and Qout refer to the inflow and outflow rate of this closed system, while Cair (the ambient carbon dioxide concentration) and Cdev (the gaseous carbon dioxide concentration in device) are the inflow and outflow concentrations. The concentration of gaseous carbon dioxide in the system can be modeled with the differential equation, Equation 11, where Vdev represents the volume of in-device gas.
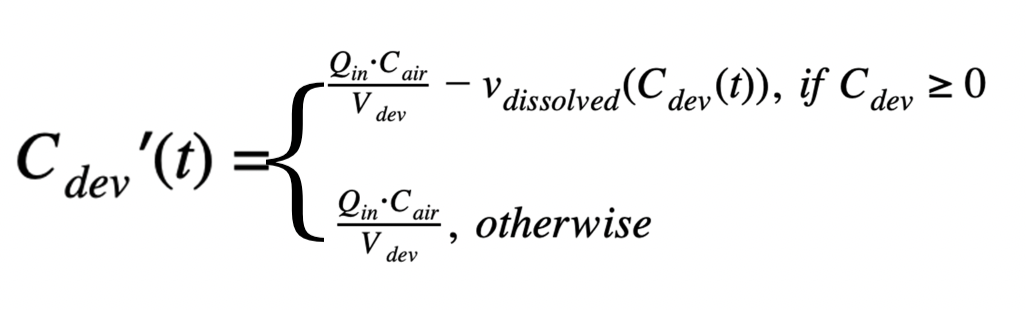
Equation 11. The equation governing the instantaneous rate of change of in-device gaseous CO2 concentration. (From Equations 6, 9, 11)
By integrating factors 1-3, the final equation representing the instantaneous rate of change of indoor carbon dioxide concentration is derived with respect to human production rate, CO2 dissolution rate and the flow rate of our device. All variables used in the final equation are listed in Table 6.
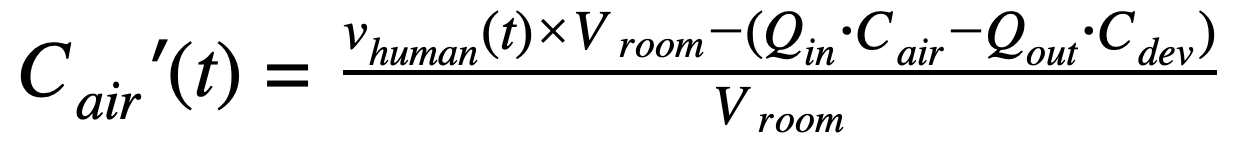
Equation 12. The final model that demonstrates the instantaneous change in CO2 concentration in the air, with human exhalation, photosynthesis, and enzyme activity of CA taken into consideration. Vroom signifies the volume of the room modeled while Vwater indicates the in-device volume of the liquid that contains cyanobacteria (From Equations 2, 9, 10)
Final Model: Discussion
While the enzymatic coefficients for CA, vmax, is obtained from literature, it is highly dependent on factors such as the quality and activity of the enzyme, and hence differs greatly from a literature source to another. The value of vmax for hCAII ranges from 414 μM, as seen in research done by Parkes et al., all the way to our previous calculation, 4.0362×10⁹, citing Silverman et al. Therefore, to get a more reliable value, we adjusted vmax in our model using our experimental data shown in Table 5. In our experiment, the inflow is from carbon dioxide gas tanks, and therefore the inflow concentration (Cair) is set at constant while the outflow concentration (Cdev) is measured. A modified vmax value of 2213 μM is acquired from empirical data by averaging the respective vmax values in our model for each trial to reach the outflow concentration (Cdev) measured from the experiment. By adjusting the vmax value to fit all sets of experimental data, we plotted our theoretical model against experimental data, as shown in Figure 5. A high correlation between our experimental data with the theoretical data is shown, suggesting that our model is practical and reliable.
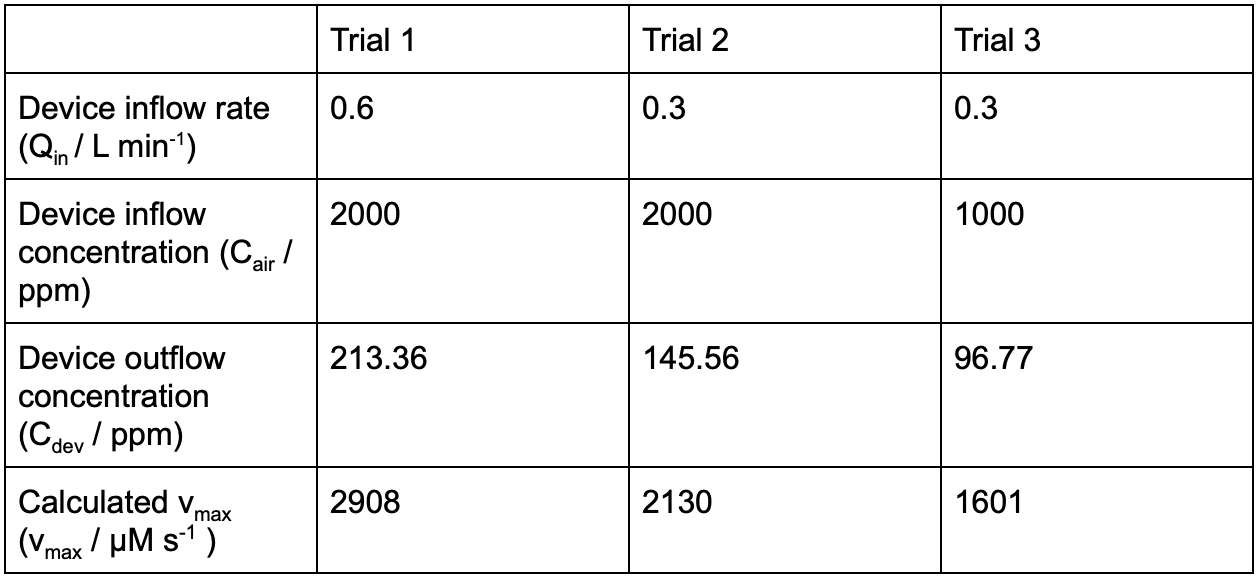
Table 5. Experimental results used to determine the value of vmax.
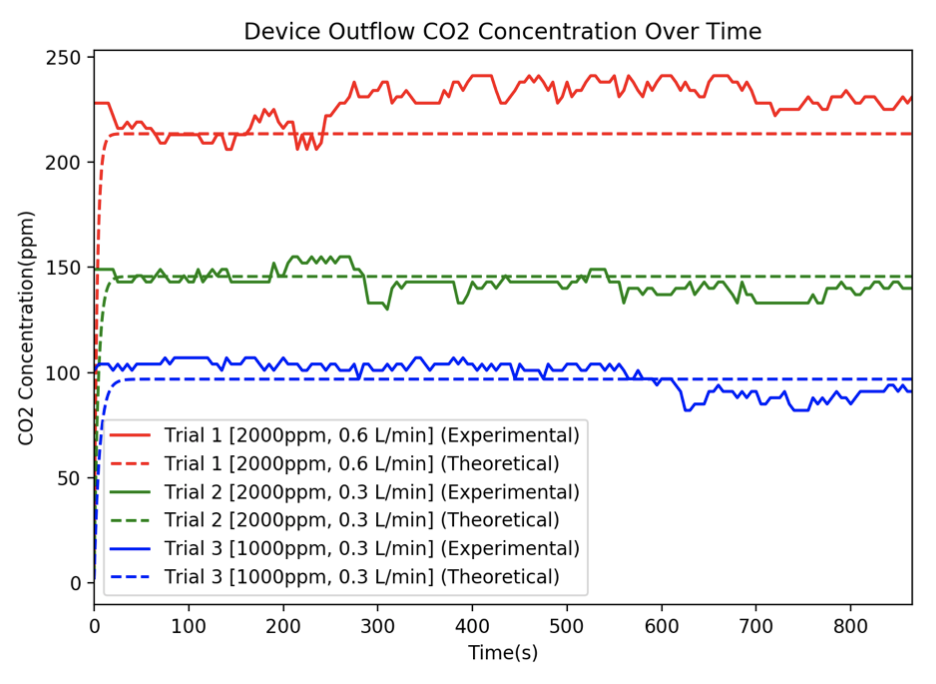
Figure 5. Graphing the modified model against experimental data.
In order to verify the reliability of our mathematical model in simulating how the indoor CO2 concentration changes over time, we also conducted an experiment with 10 people in a small room for 22 minutes. The experimental and theoretical values are shown below in Figure 6. More details about the experiment can be shown on the "Experiment" page.
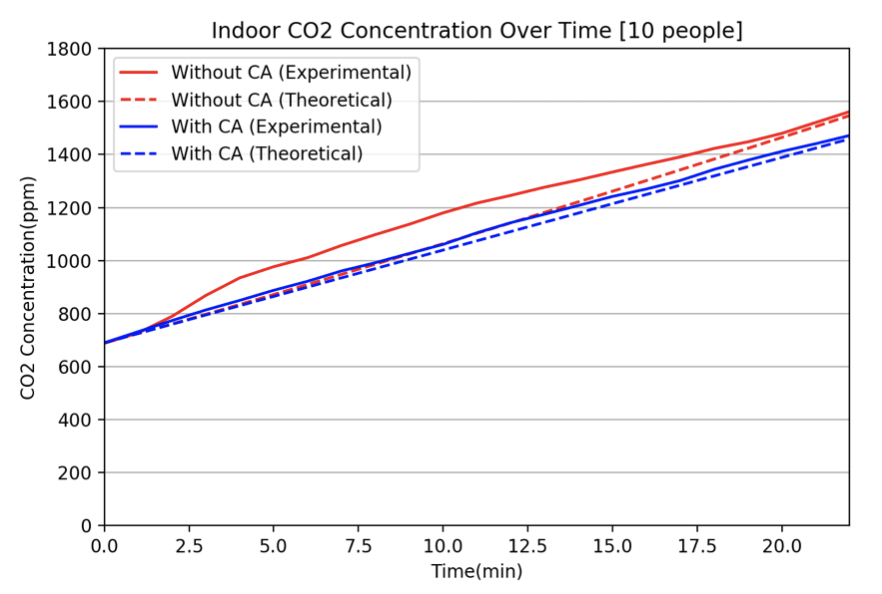
Figure 6. Modeling Indoor Concentration of CO2 with 10 people in an enclosed room. With the data we obtained from the experiment, both with and without using our prototype, we were able to see the agreement of theoretical data calculated from our model and experimental data. Our model reaches its optimal stability after roughly 18 minutes. After it has reached a more steady state, our experimental data and theoretical values are in harmony. All variables used in our final model are provided in Table 6.
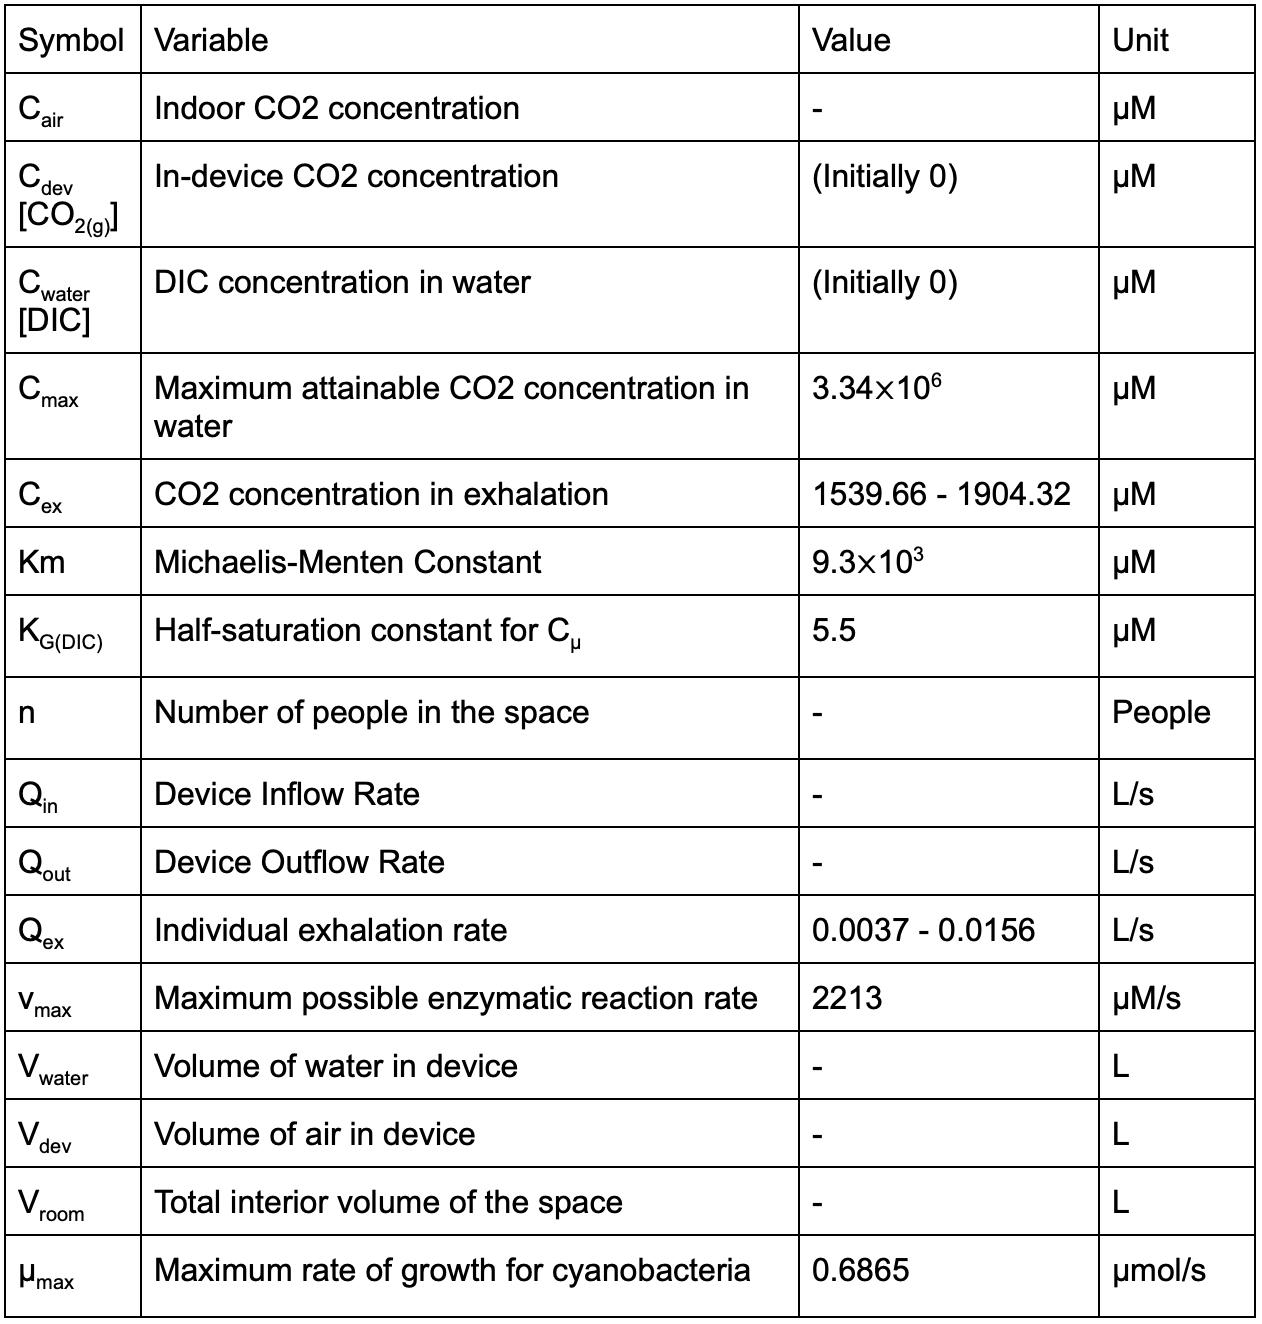
Table 6. Parameters used in the final model for Cair.
Our Software
In order to graphically represent the effect of our project prototype and simulate the change in indoor CO2 concentration over time, we have constructed a simulator based on all the formulas discussed, which considers human CO2 production rate, the enzymatic activity of CA, the photosynthetic rate of cyanobacteria and the maximum solubility of CO2 in water. Alterable variables including the number of people in the room (n), the volume of the room (Vroom), initial indoor CO2 concentration (initial Cair) and the human exhalation rate (Qex) and concentration (Cex) are provided for users to dynamically adjust the simulator to a particular condition. This simulator can help researchers and consumers of our prototype to better understand the effect of our product, CAir Pro™.
Indoor CO2 concentration Simulator
Variable Input:
Advanced Settings:
Conclusion
By taking into consideration both the incremental and decremental factors of indoor carbon dioxide concentration, adopting the Michaelis-Menten Kinetics to model enzyme activities of CA at various substrate concentrations, utilizing basic aerodynamics to determine the flow of gas into and out of our device, we were able to eventually come up with a reliable model that corresponds with our experimental data, as shown in Figure 6. A dynamic simulator was created in conjunction with our model to help graphically illustrate how indoor carbon dioxide concentration changes over time in various situations, including the number of people in the room, the volume of the room, and the number of CAir Pro™ devices used. The data obtained from our model are used frequently throughout our project development to test the feasibility of our ideas and the effect of our prototype.
References
- Clark, D. R., and K. J. Flynn. “The Relationship between the Dissolved Inorganic Carbon Concentration and Growth Rate in Marine Phytoplankton.” Proceedings of the Royal Society of London. Series B: Biological Sciences, vol. 267, no. 1447, 2000, pp. 953–959., doi:10.1098/rspb.2000.1096.
- Collier, Jackie L., et al. “Changes in the Cyanobacterial Photosynthetic Apparatus during Acclimation to Macronutrient Deprivation.” Photosynthesis Research, vol. 42, no. 3, 1994, pp. 173–183., doi:10.1007/bf00018260.
- “Dissolved Carbon Dioxide”, http://ion.chem.usu.edu/~sbialkow/Classes/3650/CO2 Solubility/DissolvedCO2.html.
- Jung, Heejung. “Modeling CO2 Concentrations in Vehicle Cabin.” SAE Technical Paper Series, 2013, doi:10.4271/2013-01-1497.
- Keren, Nir, et al. “A Light-Dependent Mechanism for Massive Accumulation of Manganese in the Photosynthetic BacteriumSynechocystissp. PCC 6803†.” Biochemistry, vol. 41, no. 50, 2002, pp. 15085–15092., doi:10.1021/bi026892s.
- Parkes, Joan Lee, and Peter S. Coleman. “Enhancement of Carbonic Anhydrase Activity by Erythrocyte Membranes.” Archives of Biochemistry and Biophysics, vol. 275, no. 2, 1989, pp. 459–468., doi:10.1016/0003-9861(89)90392-5.
- Sander, R. “Compilation of Henrys Law Constants (Version 4.0) for Water as Solvent.” Atmospheric Chemistry and Physics, vol. 15, no. 8, 2015, pp. 4399–4981., doi:10.5194/acp-15-4399-2015.
- Silverman, David N., and Sven Lindskog. “The Catalytic Mechanism of Carbonic Anhydrase: Implications of a Rate-Limiting Protolysis of Water.” Accounts of Chemical Research, vol. 21, no. 1, 1 Jan. 1988, pp. 30–36., doi:10.1021/ar00145a005.
- Turpin, David H., et al. “Predicting The Kinetics Of Dissolved Inorganic Carbon Limited Growth From The Short-Term Kinetics Of Photosynthesis In Synechococcus Leopoliensis (Cyanophyta)1.” Journal of Phycology, vol. 21, no. 3, 2004, pp. 409–418., doi:10.1111/j.0022-3646.1985.00409.x.
Quote
“”
Follow us on
Contact us
Phone: +886-4-23341797
EMAIL: biolab@ms.mingdao.edu.tw
No.497, Sec. 1, Zhongshan Rd., Wuri District, Taichung City 414, Taiwan (R.O.C.)