Difference between revisions of "Team:Mingdao/Human Practices"
| Line 117: | Line 117: | ||
<h3>Measurements of CO2 </h3> | <h3>Measurements of CO2 </h3> | ||
<div class="row"> | <div class="row"> | ||
| − | <div class="col- | + | <div class="col-6"> |
| − | <center><img src="https://static.igem.org/mediawiki/2019/0/09/T--Mingdao--hp3.png" alt="" style="max-width: | + | <center><img src="https://static.igem.org/mediawiki/2019/0/09/T--Mingdao--hp3.png" alt="" style="max-width:450px;" class="m-2"></center> |
</div> | </div> | ||
| − | <div class="col- | + | <div class="col-6"> |
<p>We measured the air quality in many places with a sensor, Air Mentor. At the beginning, we took the sensor outdoor into those places, which the sensor was measuring constantly. Thus, we could see the data of all places are begin at the ppm around 400 to 700. Except for the gym, there are no people in those places at first, and then people flocked into rapidly. The following is the details and photos of those measurements:</p> | <p>We measured the air quality in many places with a sensor, Air Mentor. At the beginning, we took the sensor outdoor into those places, which the sensor was measuring constantly. Thus, we could see the data of all places are begin at the ppm around 400 to 700. Except for the gym, there are no people in those places at first, and then people flocked into rapidly. The following is the details and photos of those measurements:</p> | ||
</div> | </div> | ||
Revision as of 13:23, 15 October 2019

Overview
Motivation
Project Design
Prototype Development
Conclusion
Overview
“Human Practice is the study of how your work affects the world, and how the work affects your work.”--Peter Carr, Director of Judging.
Our main achievements of integrated human practices were to get valuable feedback for our product improvement, as well as to raise the public awareness on the issue of indoor air quality. To upgrade our prototype, we discussed with experts in different fields in algae culturing, protocol design, and product application, etc. During the discussion, we received a lot of practical and useful advices from these experts, and we further integrated those into our project and made CAirTM as our outstanding product to meet customers’ expectations.


Motivation & Brainstorming
Measurements of CO2

We measured the air quality in many places with a sensor, Air Mentor. At the beginning, we took the sensor outdoor into those places, which the sensor was measuring constantly. Thus, we could see the data of all places are begin at the ppm around 400 to 700. Except for the gym, there are no people in those places at first, and then people flocked into rapidly. The following is the details and photos of those measurements:
- Classroom: 40 people in one class, second class of senior second grade in Mingdao.
- Outdoor: On the fence outside the biolab in MingDao.
- TEDex Hall: 85 people in the TEDex Hall in MingDao.
- SUV: 3 people in Mazda CX5 with closed circulation.
- School Bus: 40 people in one school bus.
- Table Tennis Room: 42 people in one table tennis room in Ming Hung department B1.
- Gym: 30 to 40 people in civil sport center gym in Changhua county.

Equation 1. The governing equation modeling the concentration of carbon dioxide (C) in an enclosed space at a specific time (t), given the number of people in the room (n), the CO2 concentration in exhale (Cex), the exhalation flow rate (Qex), the volume of the room (Vroom), and the initial indoor CO2 concentration (C0).
In order to better combine this equation with other factors of our model, we rewrote Equation 1 into its differential form and defined it as the instantaneous rate of human production of CO2 by exhalation at time t, vhuman(t).
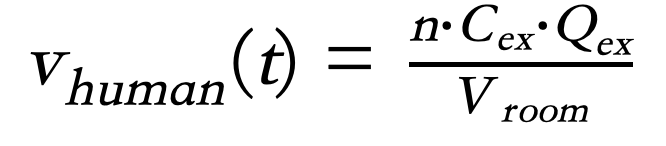
Equation 2. The instantaneous change in indoor CO2 concentration (derivative of Equation 1).
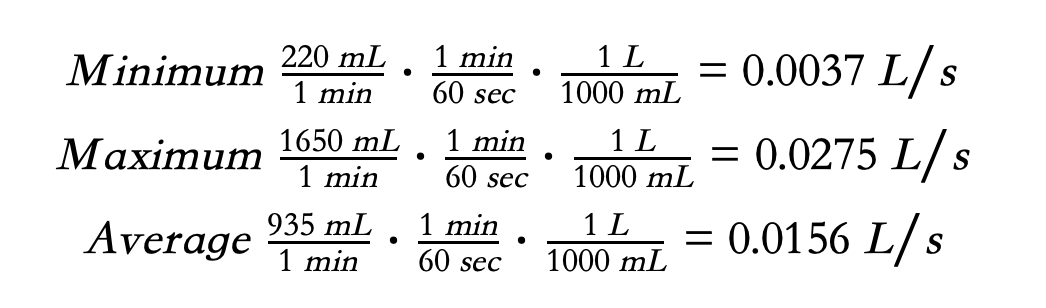
Factor 1b: Determining the Exhalation Rate of an Individual (Qex)
Exhalation rate is the amount of air that an individual exhales per unit time. From literature, the exhalation rate of an individual is shown below (Jung). The default value used in our model is calculated by the average of minimum and maximum values. Unit conversions are shown below.
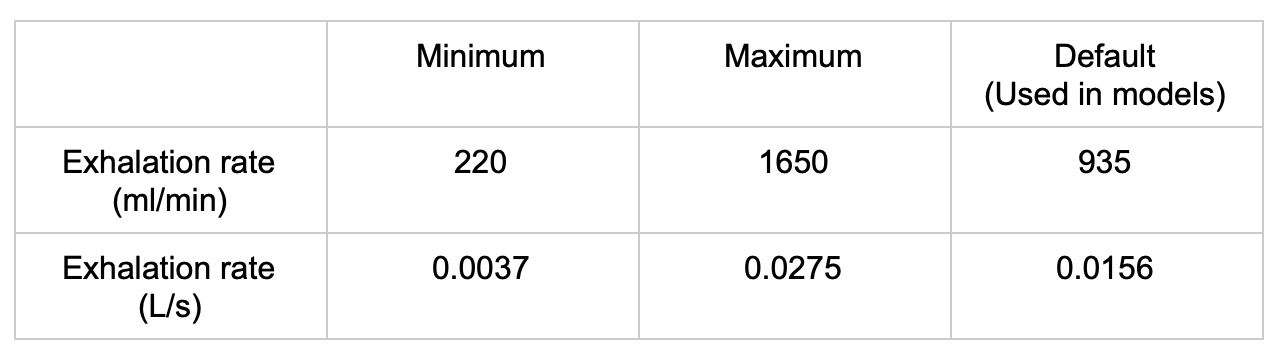
Table 1. Exhalation rate of an individual with unit conversion(Jung)
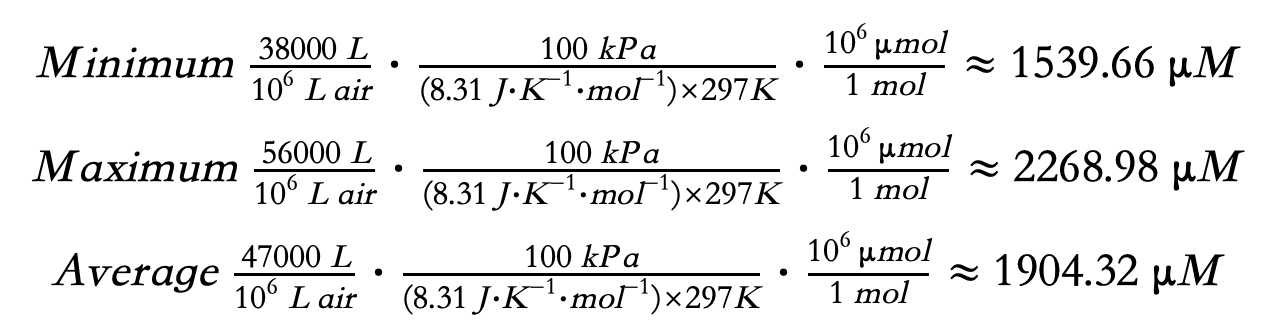
Factor 1c: Determining the CO2 Concentration in Exhale (Cex)
The CO2 concentration of an individual's breathing varies highly and is dependent on the individual and their condition. The CO2 concentration in exhale from literature is shown below (Jung). The average of minimum and maximum values is used as the default value in our model. Unit conversions are shown below, with assumptions of an environment with an air pressure of 100 kPa and an air temperature of 25 ℃ (or 297 K).

Table 2. CO2 concentration in exhale with unit conversion (Jung)
Factor 2: Modeling the Factors that Reduce Carbon Dioxide
The CO2 fixation process can be illustrated with the following diagram.
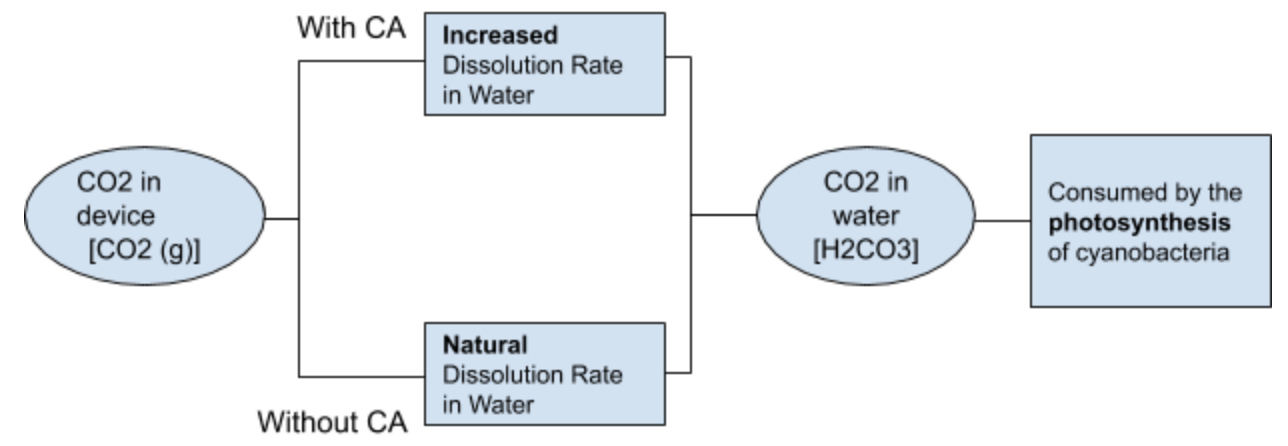
Therefore, the process of defining the sequestration of CO2 in our model can be divided into two aspects: determining the natural dissolution rate of CO2 in water (when CA is absent) and determining the increased dissolution rate of CO2 in water (when CA is present). However, the dissolved inorganic carbon (DIC; which implies the combination of H2CO3, HCO3-, CO32-, and all other forms of dissolved carbon dioxide) in water can eventually reach the maximum capacity, which is itself dependent on the pH value of the environment. How rapidly this theoretical maximum is attained is dictated by the photosynthetic rate of cyanobacteria.
Factor 2a: Determining the Natural Dissolution Rate of CO2 in Water
The natural dissolution rate of CO2 in water (vnatural) is calculated using the first-order rate constant equation, as shown in Equation 3, where 0.039 s-1 is the rate constant for the forward reaction of the hydration of carbon dioxide (CO2+H2O->H2CO3). The correlation between the concentration of gaseous carbon dioxide and the natural dissolution rate is illustrated in Figure 1.
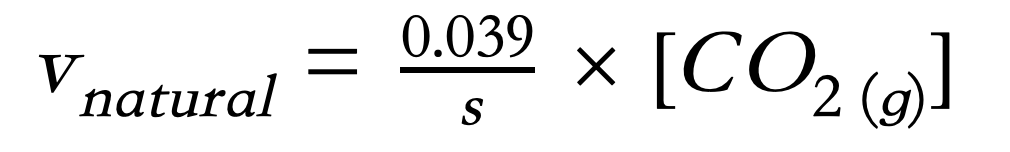
Equation 3. First-order rate constant equation for hydration of carbon dioxide.
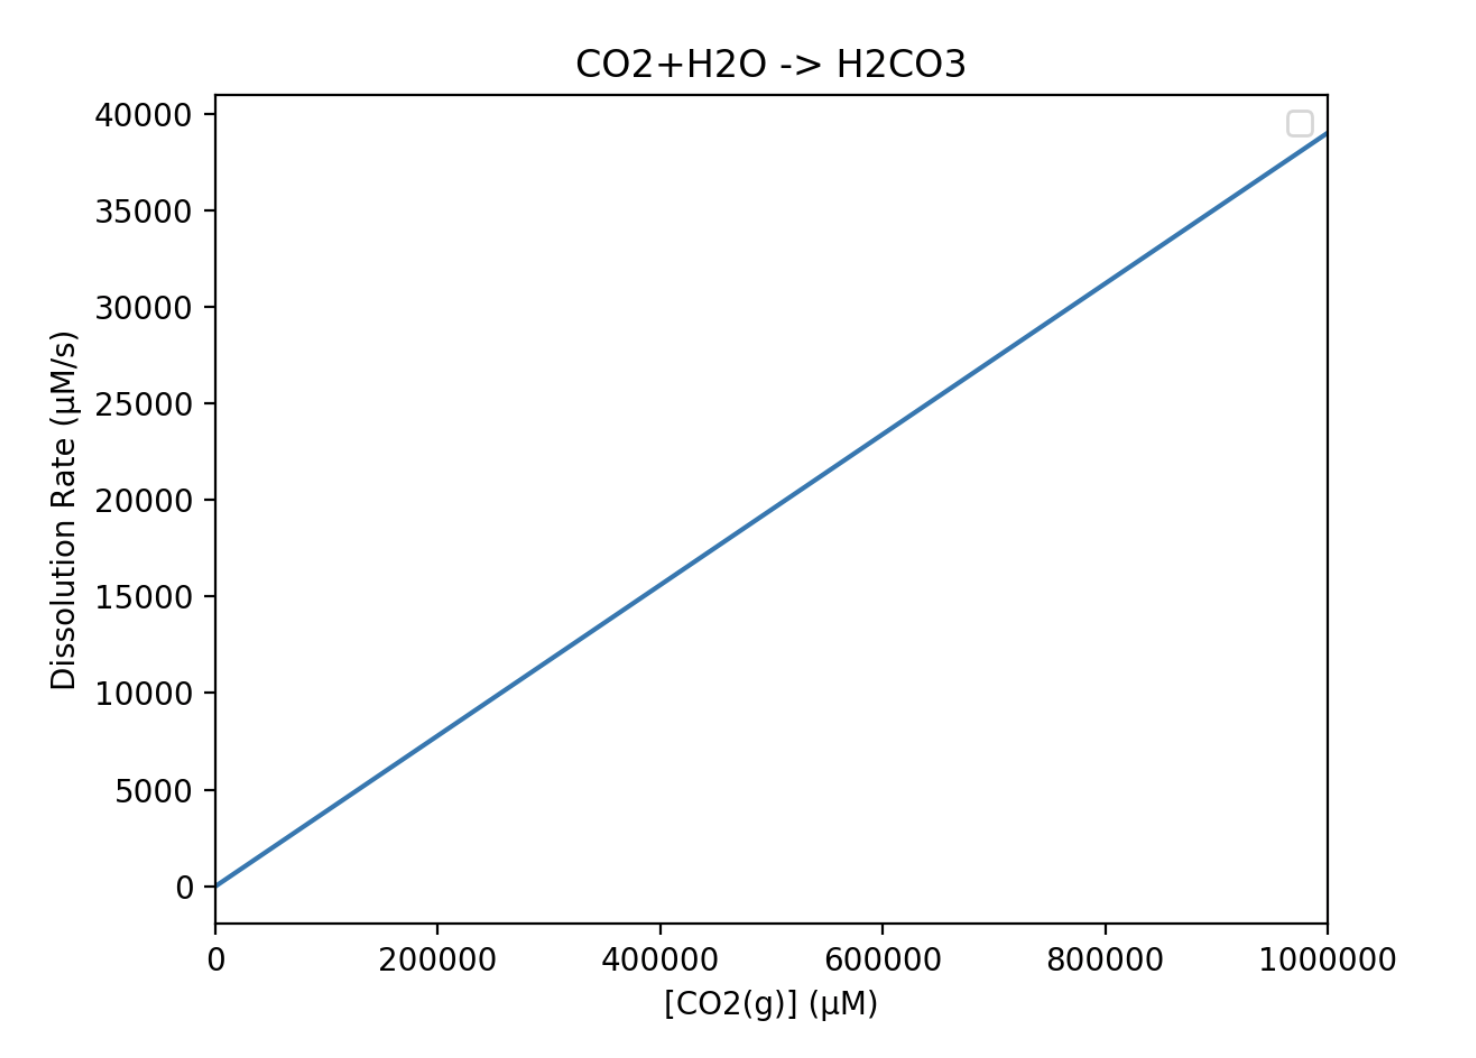
Figure 1. The linear curve modeling the correlation between the concentration of gaseous carbon dioxide and its natural dissolution rate in water.
Factor 2b: Determining the Enzymatic Reaction Rate of CA
We modeled the enzymatic rate of carbonic anhydrase with Michaelis-Menten kinetics, as shown in Equation 4. vCA represents the enzymatic reaction rate of CA; [CO2(g)] represents the concentration of substrate (in this case, gaseous carbon dioxide); vmax represents the maximum reaction rate possible; and Km is the Michaelis-Menten constant, which is defined as the substrate concentration when the enzymatic reaction rate is half of its maximum (whenv=1/2vmax).
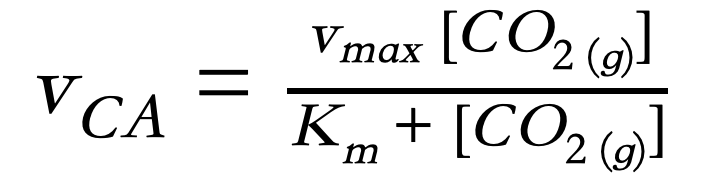
Equation 4. The Michaelis-Menten equation, which models the relationship between the concentration of gaseous carbon dioxide and the enzymatic reaction rate.
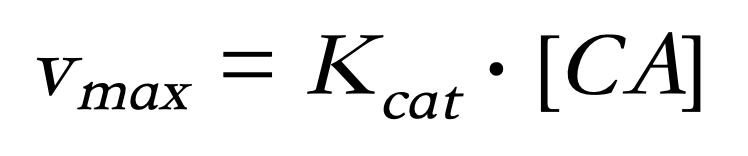
Equation 5. Calculation for vmax, the maximum reaction rate. Kcat denotes the catalyst rate constant of CA and [CA] represents the concentration of the enzyme.
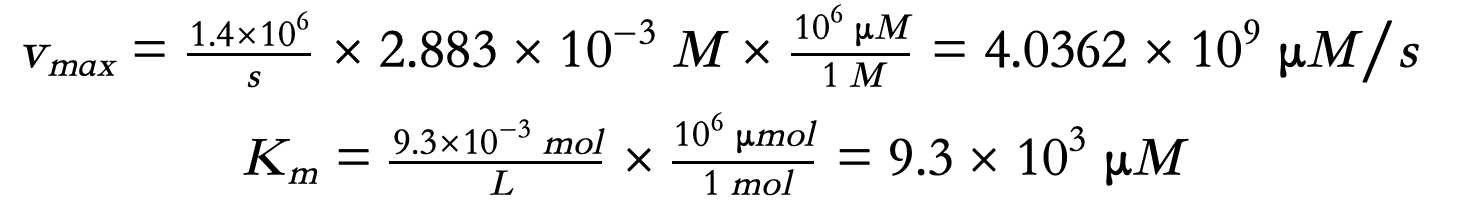
Therefore, by inserting the vmax and Km values into the model, the correlation between CO2 concentration and the reaction rate of CA can be shown. vmax can be calculated with Equation 5.
We obtained the Kcat and Km values for the human carbonic anhydrase II (hCAII) from literature. According to Silverman et al., the Kcat and Km values for hCAII are 1.4×10⁶ s-1 and 9.3×10⁻³ M, respectively. A [CA] value of 2.883×10⁻³ M is used based on the enzyme we use. Unit conversions are shown below.
Using the enzymatic coefficients for the Michaelis-Menten model, we plotted the curve in Figure 2 to model the enzyme kinetics of human carbonic anhydrase II.
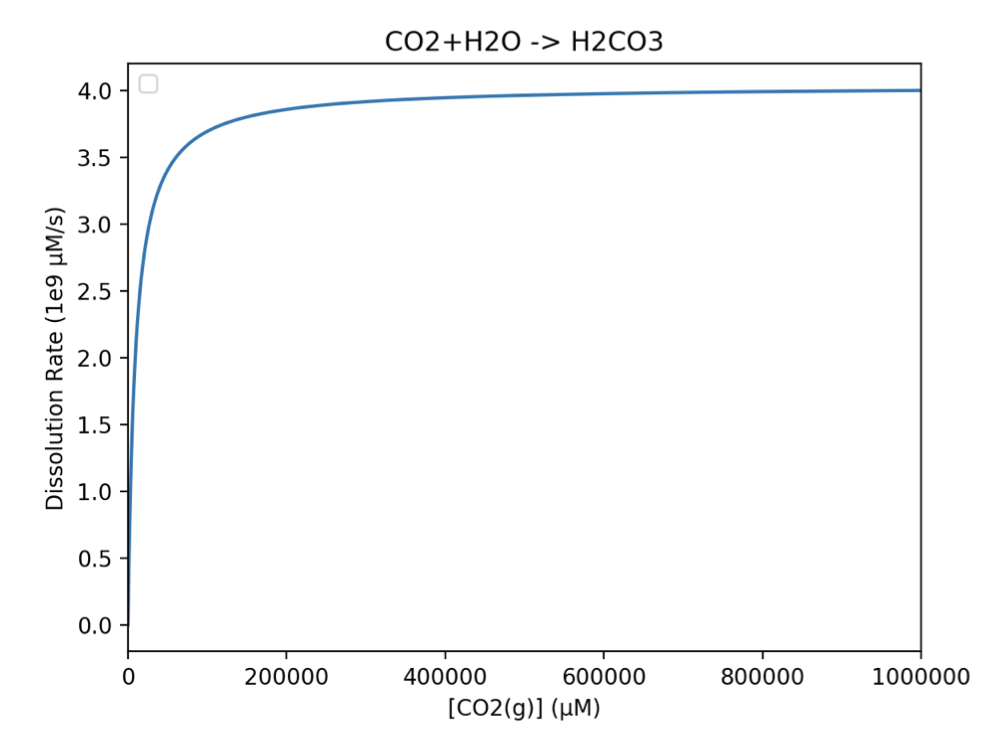
Figure 2. The Michaelis-Menten curve modeling the enzyme activities of hCAII at various concentrations of carbon dioxide.
Factor 2c: Determining the Photosynthetic Rate of Cyanobacteria in the Form of CO2 Consumption
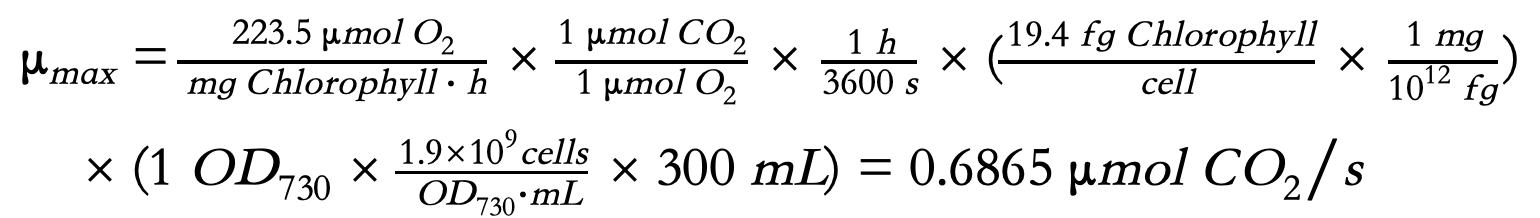
After carbon dioxide has fully hydrated and dissolved into water, the last phase in our process of CO2 sequestration is its removal by the photosynthesis of cyanobacteria Synechococcus elongatus PCC7942. The rate at which the dissolved CO2 is consumed by our cyanobacteria can be modeled with Equation 5, which models the relationship between the concentration of dissolved inorganic carbon (DIC) and the rate of carbon-specific growth (Cμ; which is also equivalent to the rate of photosynthesis vphotosynthesis), which is represented in the form of O2 production (Clark). The conversion from the amount of O2 production to CO2 sequestration is then performed using the 1:1 molar ratio between O2 and CO2 obtained from the chemical equation of photosynthesis. The maximum rate of growth μmax and the half saturation constant for Cμ, KG(DIC), specific for the cyanobacteria Synechococcus are then consulted from literature. Calculations for the final function are shown below with the parameters listed in Table 3.
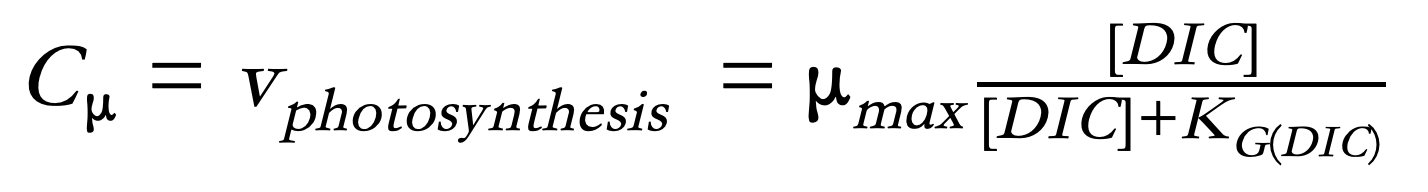
Equation 6. Relationship between the rate of photosynthesis (vphotosynthesis) and the concentration of dissolved inorganic carbon (DIC) (Clark).
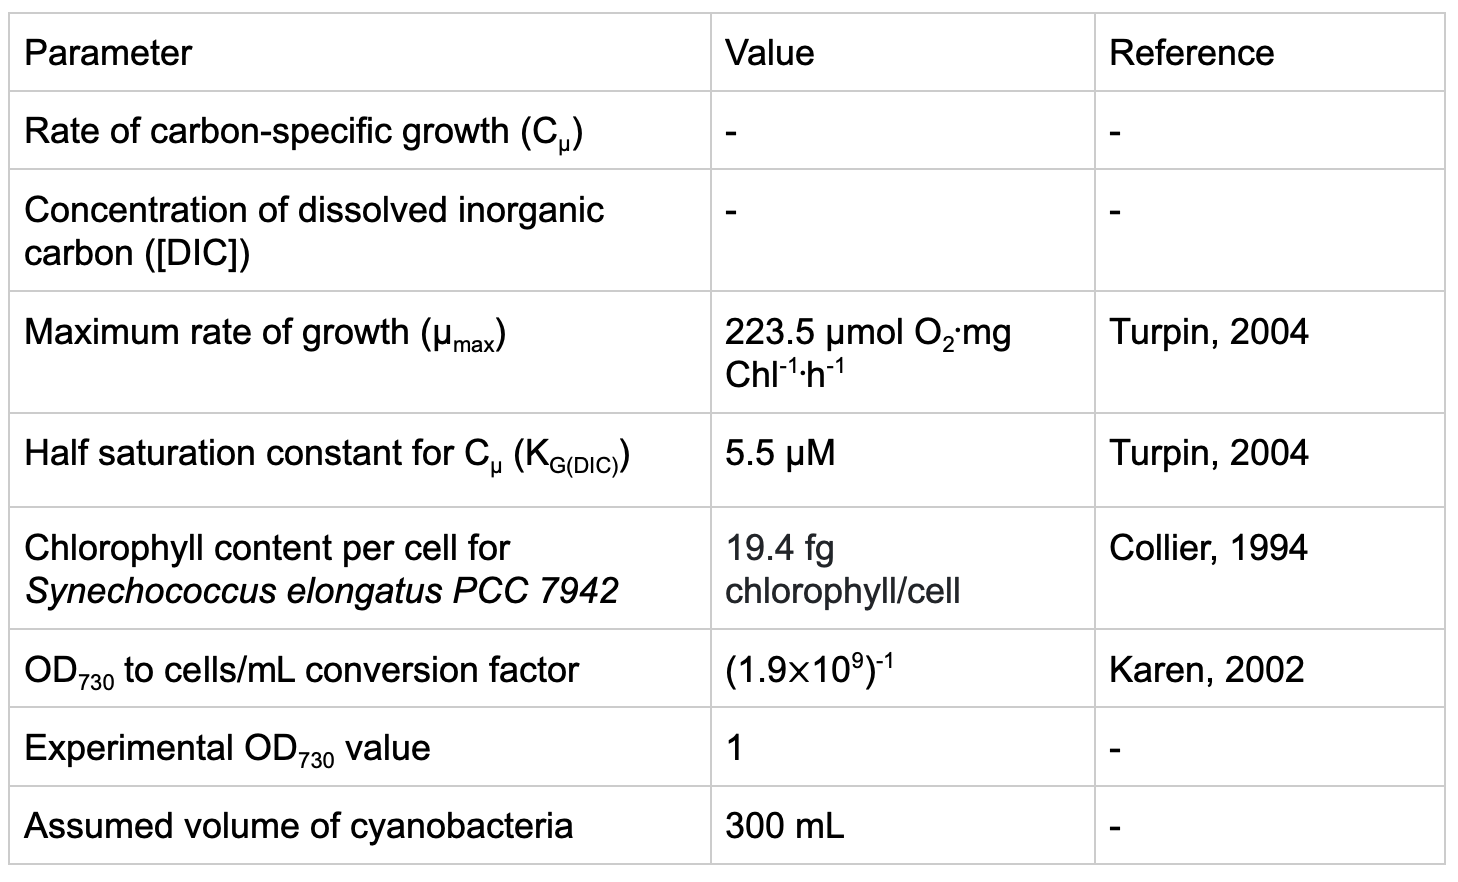
Table 3. Parameters used in calculation for Cμ
Using the converted photosynthetic coefficients that we obtained through literature for our cyanobacteria Synechococcus elongatus, we constructed a graph in Figure 3 showing the relationship between the concentration of dissolved inorganic carbon in water and the rate of CO2 consumption due to photosynthesis.
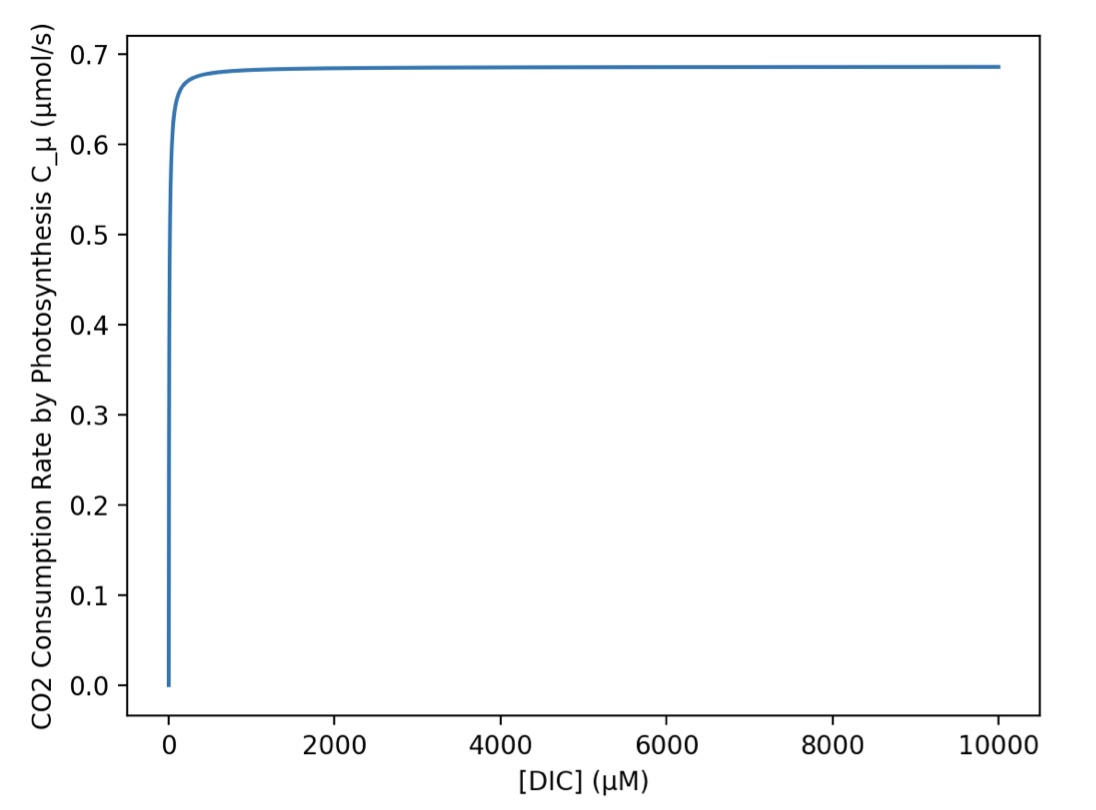
Figure 3. The Michaelis-Menten curve modeling the photosynthetic activity of Synechococcus elongatus. The CO2 consumption rate at various concentrations of dissolved inorganic carbon (DIC) is shown.
Factor 2d: Determining the Solubility of CO2 in Alkaline Environment
Our Final Model
References
Quote
“”
Follow us on
Contact us
Phone: +886-4-23341797
EMAIL: biolab@ms.mingdao.edu.tw
No.497, Sec. 1, Zhongshan Rd., Wuri District, Taichung City 414, Taiwan (R.O.C.)